Research Article | | Peer-Reviewed

Assessing Level of Service, Capacity and Future Optimization of Roundabouts in Rajshahi City Using Sidra Intersection

Received: 14 May 2024    Accepted: 5 June 2024    Published: 26 June 2024
Views:       Downloads:
Abstract

This study investigates traffic flow challenges at the bustling Mintu Chattar roundabout Situated in Laxmipur Mor, Rajshahi, Bangladesh. Located in close proximity to a hub of hospitals and medical establishments, this intersection routinely witnesses traffic congestion, becoming a familiar occurrence in the area. From dawn to dusk, traffic officers are required to step in to manage the traffic flow of countless individuals commuting to hospitals, workplaces, educational institutions, and other destinations. Our capacity analysis using Sidra Intersection software reveals significant bottlenecks, particularly during peak hours, necessitating traffic police intervention due to inadequate control measures. The research identifies key contributing factors: insufficient entry and circulatory lanes, uneven traffic distribution, and high overall traffic volume. A detailed case study of the south leg highlights the severity of the situation, with Level of Service (LOS) dropping to F during evening hours, resulting in long queues (over 61 vehicles) and delays exceeding 82 seconds per vehicle. The integration of the design life model from SIDRA software has also illustrated the correlation between Level of Service (LOS) and capacity with the projected rise in traffic volume for the next five years. In order to improve traffic flow efficiency, the study proposes exploring design optimization of the roundabout. This includes investigating the impact of geometric redesigning, such as gradual expansion of approach lanes width, on capacity at the roundabout leg, considering both existing and future traffic scenarios.

Published in International Journal of Transportation Engineering and Technology (Volume 10, Issue 1)
DOI 10.11648/j.ijtet.20241001.11
Page(s) 1-14
Creative Commons

This is an Open Access article, distributed under the terms of the Creative Commons Attribution 4.0 International License (http://creativecommons.org/licenses/by/4.0/), which permits unrestricted use, distribution and reproduction in any medium or format, provided the original work is properly cited.

Copyright

Copyright © The Author(s), 2024. Published by Science Publishing Group

Keywords

Level of Service (LOS), Capacity, Delay, Degree of Saturation, Sidra Intersection

1. Introduction
As cities strive for sustainable and seamless mobility, roundabouts have emerged as integral components of road networks, offering potential improvements in both traffic flow and safety. The choice of roundabouts as a subject of scrutiny is informed by their increasing prevalence as a traffic control mechanism in Rajshahi City. In Rajshahi City, renowned as the city of education, the burgeoning issues of escalating traffic volumes and congestion pose significant challenges to the community. Presently, the prevalence of traffic jams during peak morning and evening hours at junctions has become a commonplace sight. This predicament is exacerbated by the escalating population growth rate and the surge in the number of vehicles. As of 2024, the metropolitan population of Rajshahi stands at 984,000, marking a 2.29% increase from the previous year . Consequently, the intervention of traffic police is imperative to regulate traffic flow, necessitating overrides of traffic control devices. Without such interventions, achieving normal traffic flows, particularly at roundabout intersections, would be practically unattainable, given their reliance on driver behavior and balanced traffic flow between approaches. Akcelik defines capacity as the main factor that affects the performance of a roundabout. To evaluate the performance of a roundabout FHWA defines some key performance measures-
1) Capacity
2) Level of service
3) Degree of saturation
4) Delay
5) Queue length
As an urban center witnessing growth and development, the city has embraced roundabouts to mitigate traffic conflicts and enhance vehicular movement. However, a comprehensive evaluation of the level of service and capacity of these roundabouts is imperative to ensure their optimal functionality in accommodating the evolving transportation needs of the populace .
To execute this assessment, the study employs the SIDRA INTERSECTION 8.0 (Version 8.0.1.7778) software, recognized for its robust capabilities in modelling and analyzing traffic intersections. The utilization of mentioned lane-based intersection analyzing software allows for a comprehensive evaluation, considering factors such as island diameter, circulatory lane count, roadway width, entry lane, entry angle, traffic volume data with directional parameters and more . By leveraging this tool, the research aims to provide a nuanced understanding of the current state of roundabouts in Rajshahi City, offering insights into their capacity constraints and level of service performance during peak traffic hours. By understanding the current performance limitations of these specific roundabouts, informed decisions can be made regarding their remediation or potential need for alternative intersection designs within the study area.
Several studies have established the effectiveness of SIDRA in evaluating roundabout performance. Haque et al. employed SIDRA to analyze roundabouts in Khulna City, Bangladesh. Their findings suggest that roundabouts exceeding a degree of saturation (V/C ratio) of 0.85 experience significant congestion (Level of Service (LOS) F). This aligns with common practices in developed countries like the US and Australia, where roundabouts are designed to operate below 85% capacity While studies acknowledge the mixed traffic nature, a deeper analysis of how specific vehicle compositions (e.g., high auto-rickshaw volume) affect roundabout capacity in Rajshahi is needed . The significance of this research extends beyond mere academic inquiry, reaching into the practical realm of urban planning and traffic management. The findings are anticipated to inform policymakers, city planners, and traffic engineers, guiding them in the formulation of strategies to optimize existing roundabouts and inform the design of future intersections. Through a judicious combination of empirical data and advanced simulation techniques, this thesis aspires to contribute valuable knowledge to the ongoing discourse on sustainable urban mobility, with a specific focus on the unique dynamics of roundabouts in Rajshahi City. According to the Highway Capacity Manual (HCM), the LOS is divided into six types each of which is based on the average delay as shown in Table 1.
Table 1. Level of Service Definitions on the Basis of Delay (HCM, 2000).

Level of Service (LOS)

Control Delay per vehicle in Sec

A

d <= 10

B

10 < d < 20

C

20 < d < 35

D

35 < d < 55

E

55 < d < 80

F

80 < d

In summary, the scope of this study encompasses a thorough investigation into the performance and potential enhancements of roundabouts in Rajshahi City, with a particular emphasis on utilizing the SIDRA INTERSECTION 8.0 software for a robust and insightful analysis.
2. Data Collection and Study Area
This study deemed the necessity of collecting two types of data. These are-
1) Geometric Data
2) Traffic Volume Data
In order to fulfil the objectives of this research, it was necessary to obtain data related to the geometry of the roundabout and its traffic patterns during peak hours. The geometric data is crucial as both the capacity and level of service enhancements are contingent on the roundabout's design. This aspect holds significant importance in road design There are a lot of roundabouts in Rajshahi city in order to provide confliction free and efficient traffic flow to the people of this city. Some of the major roundabouts are Smriti Amlan Roundabout (Vodra Mor), Kamaruzzaman Chattar (Railgate), Mintu Chattar (Laxmipur Mor), Ghora Chattar (City Bypass Mor) and Aam Chattar (Naodapara). Among these circular rotary intersections, Mintu Chattar roundabout was chosen which was constructed in Laxmipur Mor, Rajshahi. The selection of the specific roundabout was determined by considering its size and the volume of vehicles it accommodates within the target population. Both comprehensive geometric and traffic data sought to accurately reflect the prevailing conditions during peak hours.
The main reason to choose Mintu Chattar for this study of assessing capacity and level of service (LOS) due to its unique traffic characteristics and surrounding land use. Situated in Laxmipur Mor, Rajshahi, this intersection is positioned near a concentration of hospitals and medical institutions, frequently experiencing traffic congestion. Thus, this roundabout provides an ideal environment to evaluate the effectiveness of roundabout design in managing traffic flow in areas with high volumes of emergency vehicles and potential driver urgency.
2.1. Geometric Data Collection
To conduct an analysis of capacity and delay using Signalized Intersection Design and Research Aid or SIDRA INTERSECTION software, the gathered geometric data encompassed various parameters, including island diameter, the count of circulatory lanes, width of the circulatory roadway, inscribed circular diameter, average lane width at entry, number of entry lanes, entry angle, and entry radius. These measurements were obtained using a tape measure and applying geometric principles as well as from Google Earth (2023, accessed February 28, 2024). The geometric data of the study area was taken with the help of a fiberglass measuring tape and some were deduced with help of geometry concept.
Table 2. Geometric data of Mintu Chattar roundabout.

Roundabout Name

No. of Legs

Number of circulatory lane (m)

Island Diameter (m)

Circulatory Roadway Width (m)

Inscribed Circle Diameter (m)

Mintu Chattar, Laxmipur Mor.

4

2

8

8

24

Table 3. Summarized geometric data of approaching legs.

Leg Name

Number of Entry Lane

Average Lane Width (m)

Entry Angle (Degree)

Entry Radius (m)

Medical Road (E)

2

3.5

17

20

Court Station Road (W)

1

3

29

3.5

Greater Road (N)

2

2.75

44

15

Greater Road (S)

2

2.5

24

3

2.2. Traffic Data Collection
In the context of capacity and delay analysis using SIDRA software, accurate traffic data collection is paramount. As both traffic volume and movement patterns represent crucial parameters, data was gathered during peak periods on a sunny weekday for a continuous one-hour period. This data encompassed individual lane counts and vehicle movements in each direction, utilizing a video camera for data collection. Information about various types of vehicles traveling in different directions was gathered through video recordings of roundabouts. Instances of unusual driver behaviours, including actions like forcing gaps, disregarding the right-of-way, and overly cautious driving, were observed and manually recorded. To understand the prevalent peak hour traffic conditions, crucial traffic data was gathered at the Mintu Chattar roundabout using a video camera.
The video footage was instrumental in determining the volume of traffic for both the morning and evening peak hours. Specifically, recordings were made during the morning peak hour from 9:00 to 10:00 a.m. and the evening peak hour from 5:00 to 6:00 p.m., with data collected every 15 minutes during each period. The selection of 9:00 to 10:00 a.m. as the morning peak hour was motivated by the fact that people typically commence their workday during this period, aligning with the start times of offices, hospitals, schools, and universities. In the evening, the chosen time period reflects the highest congestion as individuals aim to return home after completing their workday. The choice of video cameras as the data collection tool offered several advantages. First, it minimized the need for on-site personnel, ensuring cost-effectiveness and minimizing disruption to traffic flow. Second, the video recordings facilitated meticulous review and analysis, fostering greater data accuracy.
This comprehensive approach provided researchers with a rich dataset encompassing both traffic volume and driver behavior, enabling a more nuanced understanding of the roundabout's overall traffic dynamics. The video analysis was instrumental in determining the vehicle count for three distinct directions: left turn, straight through, and right turn.
Table 4. The Traffic Volume at Mintu Chattar Roundabout for all Directions every 15 min (Morning Peak Hour 9:00 am - 10:00 am).

Approach Legs

Time

05:00 - 05:15

05:15 - 05:30

05:30 - 05:45

05:45 - 06:00

North Approach

L

51.5

45

59.5

59

TH

90

97.5

88.5

93

R

44.5

38.5

52

33

East Approach

L

45

43.25

50.5

46.75

TH

59

54.75

45

51

R

25.75

45.5

50.25

51

South Approach

L

41.5

22.25

38.75

47.25

TH

69.75

81.5

40

63

R

55

54.5

61.75

85

West Approach

L

8.5

42

73.5

13

TH

27.25

62

16.5

56.5

R

17.5

18

64.75

9.5

Table 5. The Traffic Volume at Mintu Chattar Roundabout for all Directions every 15 min (Evening Peak Hour 5:00 pm - 6:00 pm).

Approach Legs

Time

05:00 - 05:15

05:15 - 05:30

05:30 - 05:45

05:45 - 06:00

North Approach

L

74

61.5

79.5

95

TH

85.5

75

91.5

101

R

72.5

71

87

100.5

East Approach

L

29

38

50.5

58.5

TH

61

45.5

45

47.5

R

20.5

29

37.5

46

South Approach

L

46

52

35.5

41.5

TH

49

85

99

122

R

64.5

71.5

81.5

103.5

West Approach

L

8.5

14

16.5

13

TH

16

20

37.5

24.5

R

17.5

20.5

14

9

3. Research Methodology
To create a model of selected roundabout to analyze required inputting both physical or geometric and traffic volume data collected from the selected study site. A generalized site model of Mintu Chattar roundabout with 3 approaching legs of two lane from north, south and east directions and one lane approaching leg from west direction was generated by providing the corresponding lane width, divider width and lane number of each leg.
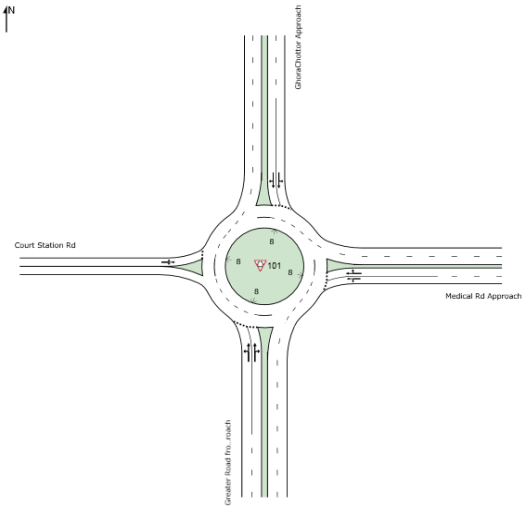
Figure 1. Generated Layout of Mintu Chattar Roundabout on SIDRA Intersection.
To accurately assess the traffic condition on intersection, SIDRA Intersection requires some important volume factors such as flow scale, growth rate, peak hour factor (PHF), etc.
Flow Scale: Flow Scale refers to a multiplier utilized to adjust the rate of vehicle and pedestrian traffic demand flow, allowing for the examination of variations in capacity estimates and performance metrics. For this study, the default value of 100% was used to analyse the maximum stress condition of the roundabout.
Growth Rate: Growth rate refers to the yearly percentage increase in volumes of vehicle and pedestrian demand The Roads and Highways Pavement Design Guide from 2005 specifies a growth rate of 8% to 10% for the national highways of Bangladesh.
Peak Flow Factor (PFF): The peak flow factor is the ratio of the average flow rate observed throughout the entire flow period to the average flow rate noted during the peak flow period. This factor aligns with the concept of the peak hour factor (PHF), particularly when the total flow period spans 60 minutes.
Traffic engineers prioritize peak-hour traffic volume when assessing capacity and related parameters due to its critical nature. The evaluation of level of service relies on peak flow rates observed within this hour, as significant fluctuations typically occur within shorter timeframes. It is customary to use the peak 15-minute flow rate for analysis, even though flow rates are typically expressed in vehicles per hour rather than vehicles per 15 minutes. The relationship between peak 15-minute flow rate and the full hourly volume is defined by the peak-hour factor (PHF), as outlined in the reference (Authority, 2003).
PHF=hourly volume4×(volume count at highest 15 min)
Figures 2 and 3 technically presents the two most important parameters vehicle movement data modified by peak flow factor (PFF) and accompanied by the percent value of heavy vehicles in three directions (left, straight through and right turn) which helps the assessment of roundabout.
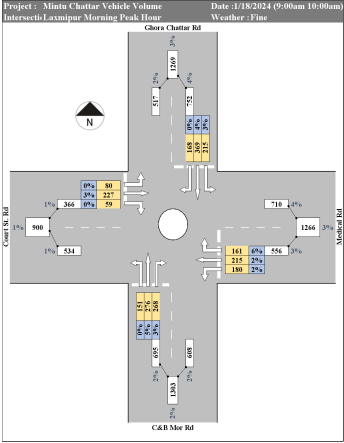
Figure 2. Summarized Traffic Volume Data in Each Direction for Each Approaching Leg (Morning) Generated by Microsoft Excel.
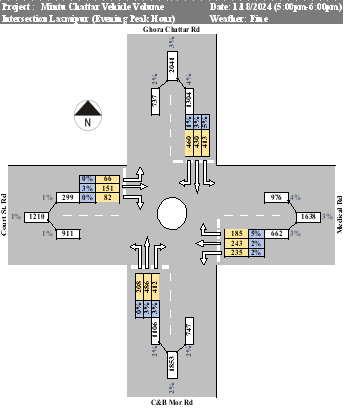
Figure 3. Summarized Traffic Volume Data in Each Direction for Each Approaching Leg (Evening) Generated by Microsoft Excel.
Table 6. Passenger Car Unit (PCU) Value (MoC, 2005).

Vehicle Type

PCU Values

Truck

3

Bus

3

Minibus

3

Microbus

1.5

Utility

1

Car

1

Auto Rickshaw, Baby Taxi, Auto

0.75

Motorcycle

0.75

Bicycle

0.5

Cycle-rickshaw, Van

2

Bullock Cart

4

To achieve a standardized measure for traffic volume, Passenger Car Equivalent (PCU) factors are employed. These factors convert the actual number of vehicles into PCUs, with one PCU representing the traffic impact of a typical passenger car. Table 6 presents the PCU values adopted from the Ministry of Communication's Revised (MoC, 2005) guidelines for highway geometric design. North Approach (Greater Road) Volume Input report is shown here in Figure 4.
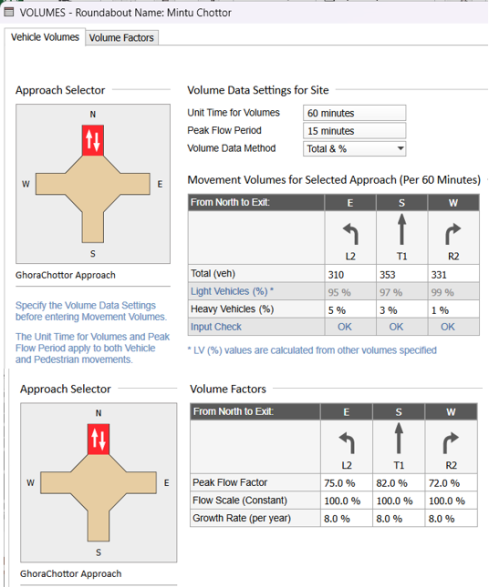
Figure 4. North Approach Volume Input Report.
Vehicle Speed Input Report: Taking into account sight distance and the required turning radius, it's possible to lower the design speeds. However, if the speeds are reduced too much, it could lead to longer wait times at roundabouts, ultimately decreasing the level of service. Figure 5 illustrates the common connection between the speed’s vehicles operate at roundabouts and the size of the Central Island. (IRC:65, 2017)
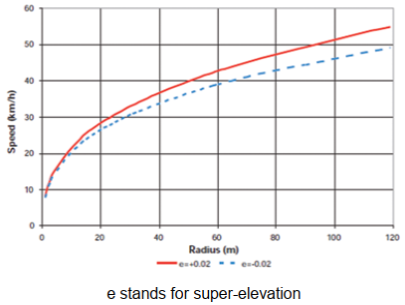
Figure 5. Relation Between Vehicle Velocity and Island Radius (IRC:65, 2017).
In our case, the Mintu Chattar roundabout has 8m inscribed diameter. Depending on the vehicle condition and class the vehicle speed was found as 20 km/h.
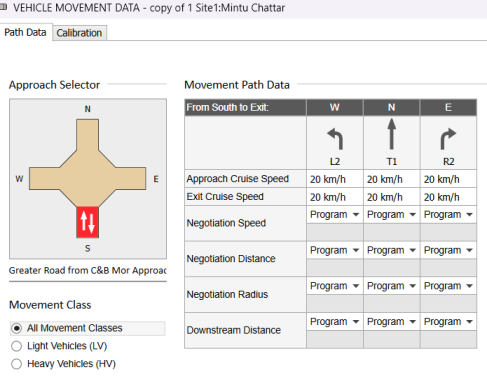
Figure 6. Vehicle Movement Velocity Input Report.
4. Results and Discussion
The factors those describe the performance of a roundabout are mainly degree of saturation, level of service (LOS), capacity and average delay. Detailed discussion of these terms is quite important for intersection assessment and future optimization.
Table 7. Degree of Saturation, Delay and LOS for All Approach Leg Procced by SIDRA.

Mintu Chattar Roundabout

Approaches

Intersection

South

East

North

West

Degree of Saturation

1.398

0.767

0.945

0.948

1.398

Delay (Control)

196.5

13.2

29.4

44.1

82.4

LOS

F

B

C

D

F

The saturation degree of each route is a significant and sensitive factor in this study due to its direct influence on the intersection’s average delay, a measure of the intersection’s service level. This is attributed to the need for specialized data planning for theoretical calculations.
The delay at a signal-controlled intersection refers to the additional time a vehicle spends at the intersection, which is calculated as the difference between its arrival and departure times. This can also be understood as the surplus time a vehi cle is required to wait at an intersection, beyond what would be needed if the traffic could flow freely without any interruptions. The delay results are depicted in Figure 7. During the evening rush hour, Greater Road from C&B Mor (south) is marked in red, indicating a Level of Service (LOS) F. Conversely, Medical Road in right, straight and left turn directions is marked in blue, signifying a LOS B, which corresponds to the least delay. There is an inverse relationship between delay and the level of service; as delay decreases, the LOS improves. The average delay for the Mintu Chattar Roundabout has been noted to be 82.4 seconds.
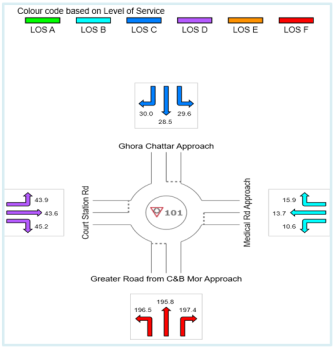
Figure 7. Average Delay of Mintu Chattar Roundabout for All Approaches.
According to the Highway Capacity Manual (HCM), the LOS is divided into six types each of which is based on the average delay as shown in Table 8. To evaluate the LOS for the current situation, the mean delay at Mintu Chattar intersection was calculated by SIDRA Intersection software.
Table 8. Level of Service Definitions on the Basis of Delay (HCM, 2000).

Level of Service (LOS)

Control Delay per vehicle in Sec

A

d <= 10

B

10 < d < 20

C

20 < d < 35

D

35 < d < 55

E

55 < d < 80

F

80 < d

The roundabout's performance is evaluated using the degree of saturation (V/C ratio) and the corresponding Level of Service (LOS) according to the guidelines established in the United States Highway Capacity Manual (US HCM). An Environmental Factor can be adjusted within SIDRA to account for varying operational conditions. This factor allows for calibration to represent either less restricted environments with higher capacity (values closer to 2.0) or more restricted environments with lower capacity (values closer to 0.5). The standard default value is 1.0, which aligns with the US HCM models when using the SIDRA Standard capacity model (default value of 1.2) .
Table 9. Summarized Capacity Analysis Results on The Intersections (Morning).

Roundabout Name

Total Vehicle Flow (PCU)

Effective Capacity (vehicle/h)

Degree of Saturation (V/C)

Average Delay (sec)

Level of Service (LOS)

Mintu Chattar, Laxmipur

2755

2410

1.143

47.5

D

Table 10. Summarized Capacity Analysis Results on the Intersections (Evening).

Roundabout Name

Total Vehicle Flow (PCU)

Effective Capacity (vehicle/h)

Degree of Saturation (V/C)

Average Delay (sec)

Level of Service (LOS)

Mintu Chattar, Laxmipur

3371

2410

1.398

82.4

F

Based on the data presented in Table 10, it is evident that the Mintu Chattar roundabout experiences the lowest degree of saturation, resulting in a level of service (LOS) of F. Detailed lane-by-lane capacity analysis has been conducted for the Mintu Chattar roundabouts, summarizing capacity at individual legs, degree of saturation, and opposing flow. The summarized capacity analysis results for the approaches or legs are provided in Table 11.
By observing the V/C column of Table 11, which is based on US HCM, it is easy to identify the legs which are in critical condition.
Table 11. Summarized capacity analysis results on the approaches or legs.

Leg Name

Entry Traffic on Legs (PCU)

Opposing Circulatory Flow (PCU)

Degree of Satn. (V/C)

Capacity at Legs (PCU)

V/C (SIDRA)

V/C (HCM6)

Medical Road (E)

662

982

0.92

982

0.67

0.705

Court Station Road (W)

299

812

0.958

312

0.96

0.541

Greater Road to Ghora Chattar (N)

1304

521

0.993

1312

0.99

0.851

Greater Road to C&B Mor (S)

1106

896

1.469

753

1.47

0.892

Table 11 shows the Greater Road from C&B Mor (south) leg with critical condition. Main causes responsible for the LOS F grade of the critical conditioned data can be stated as-
1) Low entry radius of 3 meters and high entry angle of 24 ° can be termed responsible for creating congestion and slowness while sharp left turn from Greater Road to Court Station Road.
2) Temporary shops of fruit and hawkers beside the road placed at the entry point of roundabout creates bottleneck condition creating congestion by decreasing road or length width.
3) Pedestrians contributing to delays and congestion by crossing the road through the roundabout island increasing average delay of the approaching leg.
We can also generate the performance data of Mintu Chattar roundabout for upcoming years to check its sustainability. It can be now depicted that the relation of LOS and Capacity with the increasing volume or traffic flow over the period of 5 years by allowing SIDRA to analyse with design life model.
Table 12. Design Life Analysis for Future 5 Years.

Year

Demand Flow (Total) (PCU/h)

Capacity (Total Eff.) (PCU/h)

Degree of Satn.

Delay Worst Mov. (sec)

Delay (Average) (sec)

Travel Speed (km/h)

2024

3371

2410

1.398

197.4

82.4

14.7

2025

3640

2281

1.596

283.6

118.2

12.8

2026

3932

2199

1.788

368.3

156.5

11.3

2027

4246

2148

1.977

452.0

198.8

10.0

2028

4586

2148

2.135

522.0

242.2

8.9

2029

4953

2145

2.309

599.7

291.5

8.0

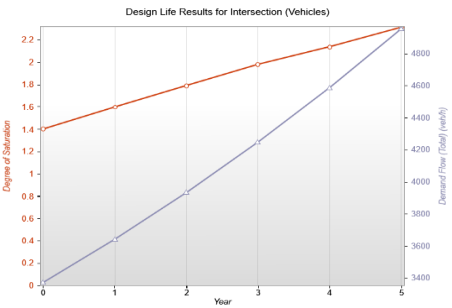
Figure 8. Graphical Representation of increase of Demand Flow and Degree of Saturation with Time.
The Degree of Saturation, represented by the orange line in Figure 8, shows a steady increase over the years, suggesting that the intersection is becoming progressively more saturated. The Demand Flow, represented by the blue line, also shows an increase over time, but at a slightly steeper rate. This indicates that as the number of vehicles passing through the intersection each hour increases, the intersection becomes more saturated. This graph is a clear representation of the relationship between the Degree of Saturation and the Demand Flow at an intersection over time. It provides valuable insights into the performance of the intersection and can be used to make informed decisions about traffic management and infrastructure planning. The Figure 9 demonstrates the inverse relationship between delay and travel speed over a span of 5 years. The green line represents delay in seconds, which increases from approximately 82.4 seconds in the first year to nearly 291.5 seconds in the fifth year. This suggests that the efficiency of the intersection is improving over time, as vehicles are experiencing less delay.
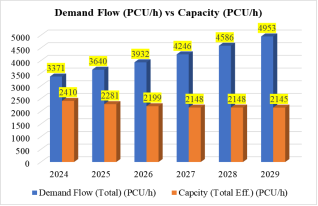
Figure 9. Demand Flow Vs Capacity Comparison of Future 5 Years.
From the graph, it’s evident that the Capacity exceeds the Demand Flow each year from 2024 to 2029. This indicates a critical system where the capacity is being outstripped by demand. However, it’s important to note that while the demand flow is increasing each year, the capacity is slightly decreasing also. This could potentially lead to capacity issues in the future if the trend continues, which is also shown below in Figure 10.
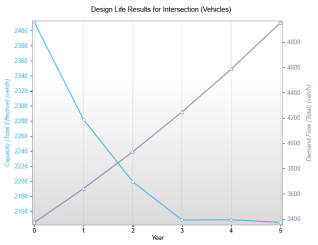
Figure 10. Comparison Between Demand Flow and Capacity over a Period of 5 years.
Future Optimization: To ensure sustainable performance of Mintu Chattar roundabout we can optimize the geometric parameters such as number and width of entry lane, number and width of circulatory road lane, entry radius and entry angle.
To find solution for the poor condition (LOS F) of south approach leg (Greater Road from C& B Mor) we can increase the entry and circulatory lane width by 10 percentage to observe the improvement of degree of saturation and average delay factors. To ensure LOS E, it took additional 50% of entry lane width of south leg.
Table 13. Effect of Expanding Lane Width on Degree of Saturation, Average Delay and LOS.

Percent Increase of Entry Lane Width (%)

Degree of saturation

Avg Delay (sec)

Level of Service

10%

1.314

158.5

LOS F

20%

1.234

122.4

LOS F

30%

1.155

88.7

LOS F

40%

1.065

51.7

LOS E

50%

1.005

31

LOS C

But following this method makes other adjacent legs over-saturated. Thus, proper balance of optimization among the approach legs should be maintained.
By optimizing the number of circulatory road lane number and by providing an additional lane in the entry section of approaching leg can enhance the performance of the roundabout. Expanding the approach gradually (known as flaring) through adjustments in entry geometry can lead to increased capacity at the roundabout leg. Additionally, several essential geometric features of an optimal roundabout, including deflection and splitter islands, are not be present in every leg configuration.
5. Conclusions
With the summarized data provided, assessing the roundabout's capacity using SIDRA software is feasible. However, additional data are necessary to comprehensively evaluate the roundabout's capacity and driver behaviour. The Environmental Factor encompasses various aspects of the roundabout environment, including its design type, visibility, gradients, operating speeds, vehicle sizes, driver behaviour (such as aggressiveness and alertness), pedestrian presence, heavy vehicle activity (such as goods vehicles and buses), parking turnover, and other relevant factors affecting movements on approach and exit sides, as well as along the circulating road. Based on the analytical findings of this study, the comprehensive assessment of the capacity showed high traffic volume in both morning and peak period hours than the effective capacity of 2410 PCU/h. The capacity analysis of the Mintu Chattar roundabout reveals that most of the roundabout’s legs are facing significant issues of oversaturation. It has been observed that during peak hours, traffic police intervention is required to manage the traffic as the existing traffic control devices are unable to effectively regulate the flow. The level of service was found to be extremely low (LOS F), indicating a situation where the flow is forced or disrupted, and demand generally exceeds capacity. With the LOS at F, a backlog queue of 61.1 vehicles and 434.7 meters was observed, leading to an average delay of 82.4 seconds per vehicle. This delay is expected at LOS F. Enhancement strategies such as expansion of entry and circulatory lane width and increase of their number with required splitter island and other traffic controlling measures to control pedestrian movement should be implemented on Mintu Chattar roundabout.
6. Limitations and Future Research Scopes
The analysis was constrained by limited data availability, particularly regarding peak hour traffic, and the complexity of gathering pedestrian volume data. To address these limitations, further studies should focus on accumulating more comprehensive data sets. This additional data would refine capacity analysis charts and facilitate the improvement of roundabout track services. The refined charts could serve transportation authorities in implementing measures to enhance roundabout intersections and in assessing traffic capacity concerning land use. Additionally, these charts could be instrumental in forecasting traffic patterns, especially with the potential increase in traffic due to new land developments.
The absence of complete geometric data at Rajshahi City roundabouts necessitated the use of analytical methods, specifically employing SIDRA Intersection software. However, this limitation underscores the importance of obtaining accurate geometric data for future analyses. Therefore, it is recommended that efforts be made to collect comprehensive geometric data for roundabouts in Rajshahi City to facilitate more robust capacity and level of service analyses in subsequent studies.
Abbreviations

FHWA

Federal Highway Administration

HCM

Highway Capacity Manual

MoC

Ministry of Communication

RCC

Rajshahi City Corporation

RHD

Roads and Highways Department

SIDRA

Signalized Intersection Design and Research Aid

TRB

Transportation Research Board

Acknowledgments
The authors of this article would like to express their sincere gratitude to the esteemed faculty members of the Department of Civil Engineering at Rajshahi University of Engineering & Technology for enabling them to conduct this study with their guidance, encouragement and expertise.
Author Contributions
Akhtar Hossain: Conceptualization, Project administration, Supervision, Validation.
Arfan Siddiquee Sazid: Data curation, Methodology, Software, Formal Analysis, Writing – original draft
Rakibul Hasan: Funding acquisition, Investigation, Resources
Funding
This research was completed independently, without any designated funding, as part of the authors' recognized personal research initiatives.
Data Availability Statement
The data available from the corresponding author can be provided for verification purposes.
The data supporting the outcome of this research has also been mentioned in this manuscript.
Conflicts of Interest
The authors declare no conflicts of interest.
References
[1] Akcelik, R. (2005). Roundabouts: Capacity and Performance Analysis. Akcelik 1998 ARR 321, ARRB Transport Research Ltd, Vermont South, Australia.
[2] Akçelik, R. (1997). Lane by lane modeling of unequal land use and flares at roundabout and signalized intersection. Traffic Engineering & Control, 38(7/8).
[3] Akçelik, R., & Troutbeck, R. (1991). Implementation of the Australian roundabout analysis method in SIDRA. In Highway Capacity and Level of Service: Proceedings of the International Symposium of Highway Capacity, Karlsruhe, Germany, July 24-27, 1991 (pp. 7-34).
[4] Federal Highway Administration, U.S. Department of Transportation. (2000). Roundabouts: An informational guide. Publication No. FHWA-RD-00-067.
[5] Federal Highway Administration, U.S. Department of Transportation. (1997). Traffic flow theory; Chapter 8: Unsignalized Intersection theory. In TRB Special Report 165 (published in 1975, updated 1997).
[6] Haque, M. R., Rahman, M. A., Hossain, M. B., & Roknuzzaman, M. (2017). Capacity Evaluation of Roundabout Intersections in Khulna Metropolitan City by Using SIDRA. Proceedings of International Conference on Planning, Architecture and Civil Engineering, 9 - 11 February 2017, Rajshahi University of Engineering & Technology, Rajshahi, Bangladesh.
[7] Kafy, A. A., Niloy, N. R., & Ferdous, L. (2018, August 3). Estimating Traffic Volume to Identify the Level of Service in Major Intersections of Rajshahi, Bangladesh. ResearchGate.
[8] Macrotrends. (2024). Rajshahi metropolitan population. Retrieved from
[9] Nambisan, S., & Parimi, V. (2007). A comparative evaluation of the safety performance of roundabouts and traditional intersection controls. ITE Journal (Institute of Transportation Engineers), 77, 18–25.
[10] Robinson, B. W. (2000). Roundabouts: an informational guide. US Department of Transportation, Federal Highway Administration. Report FWHA-RD-00-067, Washington.
[11] Rosni, N. F. N., Danial, N. ‘Ain D., Rosli, S. A. A., & Sanik, M. E. (2023). Performance analysis of intersections along Jalan Abdul Rahman using Sidra Intersection 8.0. Multidisciplinary Applied Research and Innovation, 4(2), 92–103.
[12] Sisiopiku, V. P., & Oh, H. U. (2001). Evaluation of roundabout performance using SIDRA. Journal of Transportation Engineering, ASCE, 127(2).
[13] Zaman, N. N., & Hossain, Q. S. (2016). Evaluation of the Capacity of a Roundabout in Jessore Municipality by Using SIDRA. In Proceedings of the 3rd International Conference on Civil Engineering for Sustainable Development (ICCESD 2016), 12-14 February 2016, KUET, Khulna, Bangladesh (pp. 1127). ISBN: 978-984-34-0265-3.
Cite This Article
  • APA Style

    Hossain, A., Sazid, A. S., Hasan, R. (2024). Assessing Level of Service, Capacity and Future Optimization of Roundabouts in Rajshahi City Using Sidra Intersection. International Journal of Transportation Engineering and Technology, 10(1), 1-14. https://doi.org/10.11648/j.ijtet.20241001.11

    Copy | Download

    ACS Style

    Hossain, A.; Sazid, A. S.; Hasan, R. Assessing Level of Service, Capacity and Future Optimization of Roundabouts in Rajshahi City Using Sidra Intersection. Int. J. Transp. Eng. Technol. 2024, 10(1), 1-14. doi: 10.11648/j.ijtet.20241001.11

    Copy | Download

    AMA Style

    Hossain A, Sazid AS, Hasan R. Assessing Level of Service, Capacity and Future Optimization of Roundabouts in Rajshahi City Using Sidra Intersection. Int J Transp Eng Technol. 2024;10(1):1-14. doi: 10.11648/j.ijtet.20241001.11

    Copy | Download

  • @article{10.11648/j.ijtet.20241001.11,
      author = {Akhtar Hossain and Arfan Siddiquee Sazid and Rakibul Hasan},
      title = {Assessing Level of Service, Capacity and Future Optimization of Roundabouts in Rajshahi City Using Sidra Intersection
    },
      journal = {International Journal of Transportation Engineering and Technology},
      volume = {10},
      number = {1},
      pages = {1-14},
      doi = {10.11648/j.ijtet.20241001.11},
      url = {https://doi.org/10.11648/j.ijtet.20241001.11},
      eprint = {https://article.sciencepublishinggroup.com/pdf/10.11648.j.ijtet.20241001.11},
      abstract = {This study investigates traffic flow challenges at the bustling Mintu Chattar roundabout Situated in Laxmipur Mor, Rajshahi, Bangladesh. Located in close proximity to a hub of hospitals and medical establishments, this intersection routinely witnesses traffic congestion, becoming a familiar occurrence in the area. From dawn to dusk, traffic officers are required to step in to manage the traffic flow of countless individuals commuting to hospitals, workplaces, educational institutions, and other destinations. Our capacity analysis using Sidra Intersection software reveals significant bottlenecks, particularly during peak hours, necessitating traffic police intervention due to inadequate control measures. The research identifies key contributing factors: insufficient entry and circulatory lanes, uneven traffic distribution, and high overall traffic volume. A detailed case study of the south leg highlights the severity of the situation, with Level of Service (LOS) dropping to F during evening hours, resulting in long queues (over 61 vehicles) and delays exceeding 82 seconds per vehicle. The integration of the design life model from SIDRA software has also illustrated the correlation between Level of Service (LOS) and capacity with the projected rise in traffic volume for the next five years. In order to improve traffic flow efficiency, the study proposes exploring design optimization of the roundabout. This includes investigating the impact of geometric redesigning, such as gradual expansion of approach lanes width, on capacity at the roundabout leg, considering both existing and future traffic scenarios.
    },
     year = {2024}
    }
    

    Copy | Download

  • TY  - JOUR
    T1  - Assessing Level of Service, Capacity and Future Optimization of Roundabouts in Rajshahi City Using Sidra Intersection
    
    AU  - Akhtar Hossain
    AU  - Arfan Siddiquee Sazid
    AU  - Rakibul Hasan
    Y1  - 2024/06/26
    PY  - 2024
    N1  - https://doi.org/10.11648/j.ijtet.20241001.11
    DO  - 10.11648/j.ijtet.20241001.11
    T2  - International Journal of Transportation Engineering and Technology
    JF  - International Journal of Transportation Engineering and Technology
    JO  - International Journal of Transportation Engineering and Technology
    SP  - 1
    EP  - 14
    PB  - Science Publishing Group
    SN  - 2575-1751
    UR  - https://doi.org/10.11648/j.ijtet.20241001.11
    AB  - This study investigates traffic flow challenges at the bustling Mintu Chattar roundabout Situated in Laxmipur Mor, Rajshahi, Bangladesh. Located in close proximity to a hub of hospitals and medical establishments, this intersection routinely witnesses traffic congestion, becoming a familiar occurrence in the area. From dawn to dusk, traffic officers are required to step in to manage the traffic flow of countless individuals commuting to hospitals, workplaces, educational institutions, and other destinations. Our capacity analysis using Sidra Intersection software reveals significant bottlenecks, particularly during peak hours, necessitating traffic police intervention due to inadequate control measures. The research identifies key contributing factors: insufficient entry and circulatory lanes, uneven traffic distribution, and high overall traffic volume. A detailed case study of the south leg highlights the severity of the situation, with Level of Service (LOS) dropping to F during evening hours, resulting in long queues (over 61 vehicles) and delays exceeding 82 seconds per vehicle. The integration of the design life model from SIDRA software has also illustrated the correlation between Level of Service (LOS) and capacity with the projected rise in traffic volume for the next five years. In order to improve traffic flow efficiency, the study proposes exploring design optimization of the roundabout. This includes investigating the impact of geometric redesigning, such as gradual expansion of approach lanes width, on capacity at the roundabout leg, considering both existing and future traffic scenarios.
    
    VL  - 10
    IS  - 1
    ER  - 

    Copy | Download

Author Information
  • Department of Civil Engineering, Rajshahi University of Engineering & Technology, Rajshahi, Bangladesh

    Biography: Akhtar Hossain is currently working as a Professor at Rajshahi University of Engineering & Technology, Department of Civil Engineering. He acquired his B.Sc. in Civil Engineering from Rajshahi University of Engineering & Technology in 2001. He has published various research works and conference papers.

  • Department of Civil Engineering, Rajshahi University of Engineering & Technology, Rajshahi, Bangladesh

    Biography: Arfan Siddiquee Sazid has recently concluded his undergraduate education in Civil Engineering at Rajshahi University of Engi-neering & Technology. He is set to receive his B.Sc. in Civil Engineering from the same institution in 2024.

  • Department of Civil Engineering, Rajshahi University of Engineering & Technology, Rajshahi, Bangladesh

    Biography: Rakibul Hasan has recently finished his undergraduate studies in the Civil Engineering Department at Rajshahi University of Engi-neering & Technology. He is on track to earn his B.Sc. in Civil Engineering from the same university in 2024.