Abstract
This study establishes a coherent mathematical model for the investigation of road accidents in Bangladesh by integrating nonlinear deterministic modeling, count regression with exposure, normalized fatality-rate estimation and seasonal time-series forecasting. The analysis constructs a balanced monthly panel from January 2023 to December 2025, with 36 national monthly observations and 288 division-month observations, using four synchronized datasets on population, monthly accidents, fatalities by type of vehicle, and vehicle involvement. During the study period, Bangladesh recorded 17,046 accidents, 15,994 deaths, 20,389 injuries and 36,383 total casualties indicating a persistently high and fluctuating national toll. Analysis of the deterministic model shows that harmonic quadratic equations best describe the accidents and fatalities, a harmonic linear equation the injuries, and a cubic equation the accident severity index, confirming the absence of any single common trend structure across the burden dimensions. Seasonal-index analysis revealed that June is the month with the highest number of accidents, fatalities and injuries, while August is the lowest month for accidents and fatalities and November for injuries, indicating consistent annual patterns. At the division-month level, the negative binomial model is significantly better than the Poisson model, reducing the AIC by 275.558 points, indicating significant overdispersion in accident occurrences. The harmonic OLS model for the fatality rate accounts for 46.1% of the variation in fatalities per 100,000 individuals. The SARIMAX forecast has a 12-month seasonal memory and projects a rise in June 2026 and a fall in August 2026. The results suggest that the incidence of road accidents in Bangladesh is influenced by nonlinear trends, seasonal variations, exposure disparities, and random temporal correlations, providing a mathematically coherent basis for risk assessment and road safety strategies.
Keywords
Road Accidents, Mathematical Modeling, Negative Binomial Model, Seasonal Time-Series, Fatality Risk
1. Introduction
Road traffic collisions continue to be a major challenge for transportation and public health due to the interaction of traffic exposure, road infrastructure, vehicle type, driver behavior and environmental factors. Thus, their load is not adequately represented by simple quantitative assessments alone. A detailed mathematical approach is required to understand the temporal development of accident frequency, fatality impact, injury severity and crash intensity arising from structural and stochastic factors.
Mathematical and statistical methods are increasingly used in road safety research in the last few years, to describe the complexity of the accident system. Studies have indicated that crash data are usually nonlinear, heterogeneous, and count-based, and thus not appropriate for over-simplified analytical methods. Therefore, mathematical modeling has become a necessity in the estimation of accident frequency, crash risk assessment, and safety-based planning
| [10] | Azad Abdulhafedh, “Road Crash Prediction Models: Different Statistical Modeling Approaches,” Journal of Transportation Technologies 7 (2017), 190-205. |
| [11] | Roman Ondrejka and Lenka Moravčíková, “Mathematical Modelling within the Road Safety Management,” Acta Technológia 1 (2015), 5-8. |
| [12] | Witold Pawlus, Kjell Gunnar Robbersmyr and Hamid Reza Karimi, “Mathematical modeling and parameters estimation of a car crash using data-based regressive model approach,” Applied Mathematical Modelling 35 (2011), 5091-5107. |
| [13] | Witold Pawlus, Jan Eivind Nielsen, Hamid Reza Karimi and Kjell Gunnar Robbersmyr, “Development of Mathematical Models for Analysis of a Vehicle Crash,” WSEAS Transactions on Applied and Theoretical Mechanics 5 (2010). |
[10-13]
.
The literature has focused on statistical count models and predictive models to model accident frequency. Poisson-based methods have been used to explain variations in accident frequencies. Different data-driven and analytical methods have been compared to characterize crash events in more comprehensive predictive studies. These studies consistently show that the frequency of accidents is influenced by the visible traffic conditions, but also by the fundamental exposure factors and time patterns
| [2] | A. Venkata Kiran, T. Kiran Sai Pavan, S. Tanuj Reddy and S. Suchitra, “Predictive Modeling of Traffic Accidents: A Data-Driven Approach,” in G. Dilip et al. (eds.), Proceedings of the International Conference on Intelligent Systems and Digital Transformation (ICISD 2025), Atlantis Highlights in Intelligent Systems, Vol. 15, 2025. |
| [3] | Edmund F. Agyemang, Joseph A. Mensah, Eric Ocran, Enoch Opoku and Ezekiel N. N. Nortey, “Time series based road traffic accidents forecasting via SARIMA and Facebook Prophet model with potential changepoints,” Heliyon 9 (2023), e22544. |
| [6] | Md. Kamrul Khan and Md. Tarek Hasan, “A Poisson Regression Approach to Modeling Traffic Accident Frequency in Urban Areas,” American Journal of Interdisciplinary Studies 3 (2022), 117-156. |
[2, 3, 6]
.
Another area of research that has received considerable attention is crash severity. The impact of accidents cannot be measured just on the basis of the frequency of occurrences. Severity models have been developed using ensemble methods, classification techniques, and mechanistic models to distinguish between minor crashes and fatal or high-consequence events. The literature suggests that severity is a unique modeling challenge that requires explicit mathematical treatment, since similar crash totals can imply very different human and economic consequences
| [4] | Taqwa Alhadidi and Mohammed Elhenawey, “Modeling Crashes Severity Using Ensemble Techniques,” The Eurasia Proceedings of Science, Technology, Engineering & Mathematics 26 (2023), 357-365. |
| [8] | Kefayat Tasnim, Ankona Biswas and Md. Haider Ali Biswas, “Mathematical Approach to Assess the Severity of Road Accidents in Bangladesh Using a SEIR-type Model,” Proceedings of the International Conference on Industrial & Mechanical Engineering and Operations Management, Dhaka, Bangladesh, 2020. |
| [9] | Xi Jianfeng, Guo Hongyu, Tian Jian, Lisa Liu and Liu Haizhu, “A classification and recognition model for the severity of road traffic accident,” Advances in Mechanical Engineering 11 (2019), 1-8. |
[4, 8, 9]
.
In recent years, the role of time series and forecasting models in the study of road accidents has been emphasized. Seasonal and stochastic forecast methods such as SARIMA models and other similar predictive methods have been shown capable of detecting repetitive peaks, troughs and short term persistence in accident statistics. These methods are especially effective when crashes are caused by repetitive calendar events, mobility patterns, variations in demand due to weather, and other seasonal influences.
In addition to explanation and prediction, mathematical models have been employed for operational traffic control and enhancing road safety. These investigations show that formal analytical tools can aid in the design of interventions, traffic regulation under disrupted conditions and higher level decision making in safety management. Mathematical modeling in this context is useful for the science of understanding transport as well as for managing it efficiently
| [1] | Keshav Bamel, Saurabh Jaglan, Sachin Dass, Karuna Bamel, Amir Ali Khan, Parveen Berwal and Nakul Gupta, “Mathematical Modeling Analysis of India's Accident & Use of Fly Ash and Polymers in Road Safety,” Journal of Polymer & Composites 13 (2025), S488-S499. |
| [7] | Natalya Alexandrovna Naumova, “Application of Mathematical Modeling Methods for Operational Optimization of Urban Traffic in an Accident on a Section of the Road Network,” Civil Engineering and Architecture 9 (2021), 2140-2146. |
| [11] | Roman Ondrejka and Lenka Moravčíková, “Mathematical Modelling within the Road Safety Management,” Acta Technológia 1 (2015), 5-8. |
[1, 7, 11]
.
However, no mathematically explicit analysis of road accidents has been done on the context of Bangladesh, although some studies have indicated the importance of formal modelling. The root causes of increasing road accidents in Bangladesh have been studied and an SEIR-type mathematical model has been suggested to evaluate the severity. These contributions confirm that Bangladesh offers a significant practical need and appropriate empirical environment for sophisticated accident modeling
| [5] | Ankona Biswas, Kefayat Tasnim and Md. Haider Ali Biswas, “Mathematical Modeling Applied to Assess the Driving Factors of Increasing Road Accidents in Bangladesh,” Khulna University Studies, Special Issue ICSTEM4IR (2022), 757-767. |
| [8] | Kefayat Tasnim, Ankona Biswas and Md. Haider Ali Biswas, “Mathematical Approach to Assess the Severity of Road Accidents in Bangladesh Using a SEIR-type Model,” Proceedings of the International Conference on Industrial & Mechanical Engineering and Operations Management, Dhaka, Bangladesh, 2020. |
[5, 8]
.
Nevertheless, a major research gap remains. The existing literature to date has not produced a comprehensive framework that simultaneously accounts for nonlinear national accident trajectories, exposure-adjusted division-level count trends, normalized fatality burden, and seasonal stochastic interdependence in a single mathematical model. The majority of research being conducted today focuses on a single aspect of the accident process such as frequency, severity or prediction rather than integrating the elements within an analytical framework. To fill this gap, the present study develops a full framework of Mathematical Modeling for Road Accident Analysis in Bangladesh. It employs nonlinear deterministic equations to describe national pathways, exposure-adjusted count models for division-specific accident rates, normalized rate models to describe fatality impact, and seasonal time-series techniques for temporal correlation and prediction. This research seeks to integrate these layers to offer a mathematically interpretable and policy relevant analysis of the road accident burden in Bangladesh.
2. Data and Study Design
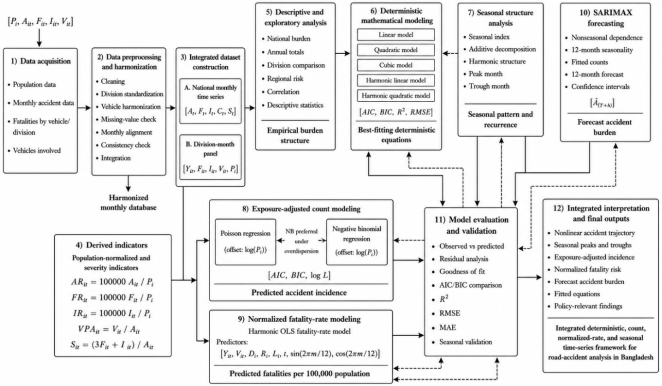
This study employed an integrated monthly panel framework to analyze road-traffic accident burden in Bangladesh. The objective was to link national temporal trends, division-level accident incidence, population-adjusted risk, vehicle-related fatalities, and exposure-sensitive severity within a single mathematical structure, as summarized in
Figure 1.
The analytical database combined four sources: division-level population data, monthly accident records, fatalities by vehicle type and division, and vehicles involved in accidents. After harmonization, the study covered January-2023 to December-2025, yielding a 36-month national time series and an eight-division monthly panel capturing accident frequency, fatalities, injuries, severity, vehicle involvement, and population-adjusted exposure.
Data preprocessing involved standardization of division names, harmonization of vehicle classifications, synchronization of observations by month and year, construction of a consolidated monthly date variable, and verification of consistency across the four source documents. For the sake of consistency in figures, tables and fitted equations, months are always labeled as January-2023, February-2023, …, December-2025. Before merging the data sets at common temporal and spatial scales, missingness and anomalies in the values were explored.
The final analytical database was structured in two levels. The main variables at the national monthly level were total accidents, fatalities, injuries, casualties and an accident severity index calculated. These aggregates were used for deterministic trend modeling, seasonal index examination, decomposition and seasonal time-series prediction. The primary response variable at the division-month level was the number of accidents for division i in month t, which we denote as Y_it. This panel was used for exposure-adjusted count regression and for normalized mortality rate modeling. The final dataset included 36 national monthly data points and 288 division-month data points:
The variables analyzed were accident totals, fatality figures, injury statistics, casualty numbers, fatalities by vehicle type, vehicles involved in accidents, division demographics, proportion of population, land expanse, population density, dependency ratio and literacy levels. Developed derived metrics that standardized burden across divisions, and differentiated between accident frequency and severity of consequences.
Let , , and denote accidents, fatalities, and injuries in division during month , and let denote the population of division . The population-normalized indicators were defined as
(1)
(2)
(3)
If denotes the number of vehicles involved in accidents, the exposure-related indicator was defined as
(4)
The accident severity index was formulated as
where fatalities were assigned a greater weight than injuries to reflect their higher consequence intensity. These transformations allowed raw accident counts to be distinguished from normalized risk, exposure intensity, and accident seriousness.
The analytical framework was purposely built in a number of phases. Phase 1 included descriptive and exploratory analysis such as national summaries, yearly totals, division-specific burden profiles, and standardized risk comparisons. The next step was the evaluation of several alternative deterministic models, including linear, quadratic, cubic, harmonic linear and harmonic quadratic formulations. In the third stage the repetitive temporal trends were analyzed by seasonal index and decomposition. The fourth phase simulated accidents at the division level using exposure-adjusted Poisson and negative binomial regressions. In the fifth phase, the standardized mortality burden was assessed using a harmonic ordinary least-squares rate model. Finally, SARIMAX was used to identify stochastic temporal relationships and to forecast national accident totals beyond the observed period.
A basic methodological aspect was the clear treatment of exposure. Accident statistics can also be misleading, because places with high population density or heavy traffic are more likely to have more crashes, just because there are more people and vehicles there. We therefore used population both as the denominator for normalized rates, and as a logarithmic adjustment in the count models. The direct measure of exposure to mobility-related was also included as a vehicle participation. This approach ensured that the count models evaluated relative accident frequency as a function of exposure and not solely as a function of differences in division size.
Transparency and reproducibility require that the four datasets be documented, including the source agency, exact dataset or report title, date of access, and availability status. The dataset used in the beginning was “Bangladesh Division Population 2022 Dataset” and it was taken from BBS. The second dataset was the “Bangladesh Road Accident Dataset, 2023-2025”, the third was the “Number of Fatalities by Vehicle Types and Division, 2023-2025” and the fourth was the “Number of Vehicles Involved in Road Accidents, 2023-2025” from BRTA. For publicly available datasets, the repository or URL should be mentioned in the final manuscript. If the document is not permitted to be redistributed, it should identify the specific licensing, administrative, confidentiality or ownership restrictions that preclude public release.
All evaluations were conducted in Python version 3.14.3. The deterministic linear, quadratic, cubic, harmonic linear and harmonic quadratic regressions were calculated using the OLS method in statsmodels. Poisson and negative binomial models with adjustment for exposure were fit using the GLM, Poisson and NegativeBinomial classes of the statsmodels library. The SARIMAX function provided in statsmodels was used for the seasonal time-series analysis and prediction. Data organization and conversion were done with pandas and NumPy, statistical analyses were performed with SciPy, and high-quality visual representations were created with Matplotlib.
The specific package versions must be documented from the analysis environment before submission. The analytical code, data dictionary, variable definitions and reproducible processing workflow should be deposited in a suitable repository (e.g. Zenodo, OSF, Figshare or an institutional archive) according to the redistribution stipulations of the original data providers. Where the release of unprocessed administrative data is not possible, the manuscript should provide the necessary code and metadata to replicate the analytical process.
The design of the study combined panel structure, national time series analysis, normalization, exposure adjustment, and multistage mathematical modeling in a cohesive fashion. This design is particularly suitable for Bangladesh where the road-traffic load varies in time and space with very different population densities, mobility levels and transportation conditions. The study used national and division-month scales to capture large time periods while retaining the regional diversity necessary for meaningful exposure-adjusted conclusions.
3. Mathematical Framework
This study’s analytical framework was developed to portray the burden of road-traffic accidents in Bangladesh as a complex system that is driven by deterministic drift, seasonal patterns, changes in exposure-adjusted count, normalized consequence severity and stochastic temporal correlation. Instead of assuming that a single statistical family can capture all the features of the accident process, the framework disaggregates the problem into mathematically distinct but interrelated layers. The framework at the national level describes the evolution of accidents, fatalities, injuries and severity by deterministic and seasonal equations. It models accident occurrences as exposure-adjusted stochastic processes and fatality impact as a standardized rate process at the division-month level. The framework combines descriptive burden, structural dynamics, exposure variability and forecasting into a single mathematical model.
3.1. Notation, Basic Structure and Derived Indicators
Let index the monthly time dimension, where for the observed study period. Let denote the calendar month associated with time , so that corresponds to January, to February, and so forth. Let index the administrative divisions of Bangladesh.
At the national monthly level, define:
Where,
To quantify consequence intensity per crash event, the study defines a national accident severity index:
The factor 3 attached to fatalities reflects the stronger consequence weight of death relative to injury. This weighted construction allows the severity process to be modeled separately from simple accident frequency.
At the division-month level, define:
The static division-level contextual variables are denoted by:
These variables enter the count and rate models as structural covariates that may shift accident incidence and normalized fatality burden across divisions.
Now,
The accident rate per 100,000 population is defined as:
The fatality rate per 100,000 population is:
The injury rate per 100,000 population is:
The vehicles-per-accident indicator, which approximates crash exposure intensity, is defined as:
The fatalities-per-involved-vehicle indicator is defined as:
The division-month severity index is:
These transformations serve two purposes. First, they normalize accident burden across differently sized divisions. Second, they separate the notions of frequency, consequence, and exposure so that one model is not forced to represent all dimensions simultaneously.
3.2. Deterministic Trend Models
The first family of models treats the national monthly series as deterministic functions of time. The goal is to identify whether the accident process follows a monotone trend, a curved nonlinear trajectory, or a seasonally modulated path.
3.2.1. Linear Trend Model
The linear trend model assumes that the monthly outcome changes at a constant rate:
where may represent , , , or , is the intercept, is the slope, and is the residual error term.
This formulation is useful as a baseline specification. However, because road-accident systems often rise and fall non-monotonically, a purely linear model is usually too restrictive.
3.2.2. Quadratic Trend Model
To allow a single turning point, the quadratic trend model is written as
Here, introduces curvature. If , the trajectory rises and then falls; if , it falls and then rises. This specification is appropriate when the burden increases during one part of the study period and moderates later.
3.2.3. Cubic Trend Model
To allow more flexible nonlinear movement with potentially two inflection changes, the cubic model is
(16)
The cubic form is useful when accident burden cannot be represented by a single arc and instead shows more complex local acceleration and deceleration.
3.3. Harmonic Seasonal Models
The deterministic polynomial models above capture long-run drift but do not explicitly model periodic seasonality. To account for regular monthly recurrence, the framework introduces harmonic terms based on trigonometric functions.
3.3.1. Harmonic Linear Model
The harmonic linear model combines a linear time trend with annual seasonality:
(17)
The sine and cosine pair jointly captures a periodic cycle with period 12 months. The amplitude of the seasonal effect is
and the phase angle is
This model allows the level of the series to drift linearly while oscillating around that trend according to the calendar cycle.
3.3.2. Harmonic Quadratic Model
To allow both nonlinear drift and seasonality, the harmonic quadratic model is defined as
(20)
This formulation contains both an annual harmonic component and a semiannual harmonic component. The annual pair captures one full cycle per year, while the semiannual pair allows a second oscillatory mode within each year. The corresponding amplitudes are
(21)
The harmonic quadratic model is particularly useful when accident burden exhibits both a nonlinear national drift and recurring within-year peaks and troughs.
3.4. Model Selection for Deterministic Equations
For each national outcome , the study compares the linear, quadratic, cubic, harmonic linear, and harmonic quadratic models. Let denote the fitted value under model . Model comparison is based on goodness of fit and parsimony using:
(22)
where is the likelihood and is the number of estimated parameters. The preferred deterministic equation is the one that provides the best balance of explanatory power and model economy.
3.5. Seasonal-Index Analysis
To complement the regression-based harmonic models, the study computes month-specific seasonal indices. Let denote the average value of a national monthly outcome in calendar month , averaged across all years in the sample. Let denote the grand monthly mean over the full study period. The seasonal index for month is then:
Equivalently, in percentage form,
If , then month has above-average burden; if , then it has below-average burden. Seasonal indices provide a nonparametric summary of the within-year pattern and therefore serve as an empirical check on the harmonic regression results.
The study next decomposes each national monthly series into trend, seasonal, and irregular components using an additive structure:
where is the long-run trend component, is the seasonal component, and is the irregular residual. In practice, this decomposition is useful because it isolates how much of the variation is attributable to systematic long-run movement, how much to recurring seasonality, and how much to residual short-run shocks.
The additive form is appropriate when the seasonal oscillation is approximately constant in magnitude across the study period rather than proportional to the level of the series.
3.6. Exposure-adjusted Count Models
At the division-month level, accident counts are nonnegative integers and therefore naturally modeled as count variables. Let denote the number of accidents in division during month .
3.6.1. Poisson Regression
The standard Poisson model assumes with conditional mean
The log-link function is specified as:
(29)
where is the month number, is a year or time index, and enters as an exposure offset. Rearranging gives
(30)
This means that the expected accident count scales with population exposure while the exponential component captures the effect of structural and temporal predictors.
The incident-rate ratio for predictor is
An implies an increase in expected accident incidence, whereas implies a decrease.
3.6.2. Negative Binomial Regression
Accident data often violate the Equi dispersion assumption of the Poisson model. Under Poisson regression,
However, if the variance exceeds the mean, the data are over dispersed. To account for this, the study also estimates a negative binomial model:
with the same log-link for but with variance
where is the overdispersion parameter. When , the model reduces to Poisson. A positive allows the conditional variance to rise faster than the mean, which is often more realistic for regional accident data.
Model comparison between Poisson and negative binomial is based on AIC, BIC, and log-likelihood. If the negative binomial model produces a substantially lower AIC/BIC, this indicates that overdispersion is materially important.
3.7. Normalized Fatality-Rate Model
The study directly models fatality rates because population-adjusted mortality is a key public health indicator. Let
The harmonic OLS fatality-rate model is specified as
(36)
This equation links normalized fatality burden to accident volume, exposure, division structure, temporal progression, and annual seasonality. The inclusion of harmonic terms ensures that fatality risk is not forced into a purely monotone time structure when recurrent seasonal effects are present.
3.8. Correlation and Inferential Structure
To assess pairwise linear association between selected variables, the study uses the Pearson correlation coefficient:
(37)
For rank-based monotonic association, the Spearman coefficient is used:
where is the rank difference for observation .
To compare mean accident levels across divisions, one-way ANOVA evaluates
against the alternative that at least one division mean differs. The test statistic is
Because accident counts may depart from normality, the Kruskal-Wallis alternative can also be used, with statistic
(40)
where is the sum of ranks in group , is the group size, is the number of groups, and is the total sample size.
3.9. Time-series Forecasting Model
The final layer of the framework model’s national accident counts as a seasonal stochastic process. Let denote national monthly accident counts. The study uses a seasonal ARIMA model with exogenous seasonal structure, commonly written as SARIMAX. In backshift notation, the general seasonal ARIMA model is
(41)
where:
i. is the backshift operator, ,
ii. are the nonseasonal autoregressive, differencing, and moving-average orders,
iii. are the seasonal autoregressive, differencing, and moving-average orders,
iv. is the seasonal period for monthly data,
v. and are the nonseasonal AR and MA polynomials,
vi. and are the seasonal AR and MA polynomials,
vii. is white noise.
For example, an AR (1) term implies dependence on the immediately preceding month, while a seasonal AR term at lag 12 captures annual memory. Forecasts are generated recursively once model parameters are estimated.
3.10. Error Measures and Predictive Evaluation
For fitted and forecast values , the study evaluates predictive performance using root mean squared error and mean absolute error:
(42)
Where appropriate, coefficient of determination is also reported:
(44)
These criteria allow comparison between deterministic fits, count-model predictions, and forecast performance.
4. Results and Discussion
4.1. National Burden Profile and Temporal Structure
The national monthly series provides an initial quantitative assessment of the magnitude, variability, and temporal organization of road-traffic burden in Bangladesh. This preliminary analysis is essential for determining whether accident frequency and consequences exhibit stable, nonlinear, or seasonally recurrent patterns before applying formal deterministic and stochastic models.
Table 1. National descriptive profile of the monthly Bangladesh road-traffic burden.
Outcome | Total | Mean | SD | Min | Median | Max |
Accidents | 17,046 | 473.500 | 96.952 | 214.000 | 469.500 | 730.000 |
Fatalities | 15,994 | 444.278 | 83.984 | 231.000 | 442.500 | 642.000 |
Injuries | 20,389 | 566.361 | 157.625 | 283.000 | 546.000 | 934.000 |
Casualties | 36,383 | 1,010.639 | 226.506 | 514.000 | 1,015.500 | 1,498.000 |
Severity index | 144.982 | 4.027 | 0.287 | 3.562 | 3.964 | 4.995 |
Table 1 shows that Bangladesh experienced a substantial cumulative burden over the 36-month observation window, with 17,046 accidents, 15,994 fatalities, 20,389 injuries, and 36,383 casualties. The corresponding monthly means were 473.500 accidents, 444.278 fatalities, 566.361 injuries, and 1,010.639 casualties, confirming that the burden remained consistently high throughout the period. The standard deviations further indicate marked temporal fluctuation, particularly for injuries (157.625) and casualties (226.506), implying that the consequence dimension of the accident system varied more strongly than accident frequency alone. The minimum and maximum values reinforce this interpretation: accident counts ranged from 214 to 730, fatalities from 231 to 642, and injuries from 283 to 934. The severity index averaged 4.027, with a minimum of 3.562 and a maximum of 4.995, which demonstrates that the average consequence intensity per crash changed materially across time rather than remaining constant. In Q1-journal terms,
Table 1 establishes that the Bangladesh road-traffic system is not only high-burden but also structurally unstable at the monthly scale.
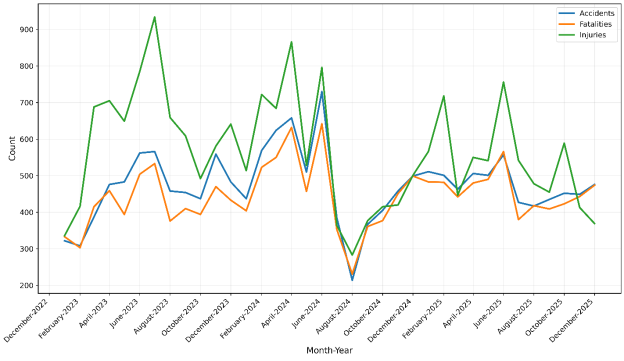
Figure 1 extends this interpretation by revealing the temporal architecture of the burden. The three national series display a clear pattern of repeated mid-year escalation followed by pronounced decline, especially in the accident and fatality curves. The accident series reached its highest observed value in June-2024 (730 accidents) and its lowest value in August-2024 (214 accidents), indicating a sharp crest-trough transition within a relatively short interval. Fatalities followed a closely synchronized path, peaking in June-2024 at 642 fatalities, which suggests that accident occurrence and fatal consequence burden were driven by a common seasonal mechanism. Injuries also exhibited strong fluctuation, but with a larger amplitude and a slightly different peak structure, reaching their maximum in July-2023 at 934 injuries. This difference in amplitude is important because it implies that accident occurrence, fatality conversion, and injury burden were correlated but not identical processes. Thus,
Figure 1 rules out a purely linear temporal interpretation and instead supports the coexistence of medium-run drift and within-year seasonal recurrence.
Table 1 and
Figure 2 establish the basis for subsequent modeling by showing that the national road-traffic burden is both highly variable and seasonally structured. These patterns support the use of nonlinear deterministic, harmonic, and stochastic time-series models rather than descriptive analysis alone.
Figure 2. National monthly accident, fatality, and injury burden in Bangladesh.
4.2. Annual and Division-level Burden Differentials
Table 2. Annual national totals and average monthly burden.
Year | Accidents | Fatalities | Injuries | Casualties | Accidents/month | Fatalities/month |
2,023 | 5,495 | 5,024 | 7,495 | 12,519 | 457.92 | 418.67 |
2,024 | 5,856 | 5,480 | 6,470 | 11,950 | 488.00 | 456.67 |
2,025 | 5,695 | 5,490 | 6,424 | 11,914 | 474.58 | 457.50 |
Annual and regional summaries show that road-traffic burden in Bangladesh varies across both time and space. The divergence between yearly trends, raw divisional counts, and normalized risk highlights the need for distinct temporal and exposure-adjusted modeling approaches.
Table 2 shows that the national annual burden did not evolve in a simple monotone manner. Total accidents increased from 5,495 in 2023 to 5,856 in 2024, before moderating slightly to 5,695 in 2025. Fatalities followed a similar but more persistent upward path, rising from 5,024 in 2023 to 5,480 in 2024 and remaining high at 5,490 in 2025. By contrast, injuries were highest in 2023, with 7,495 cases, and then declined to 6,470 in 2024 and 6,424 in 2025. Casualties also decreased from 12,519 in 2023 to 11,950 in 2024 and 11,914 in 2025. The corresponding average monthly burden confirms the same pattern: accidents per month increased from 457.92 to 488.00 and then fell slightly to 474.58, while fatalities per month rose from 418.67 to 456.67 and 457.50. This divergence between accident frequency and injury burden suggests that the Bangladesh accident system did not evolve through a single common mechanism. Instead, the temporal structure appears to involve distinct processes for crash occurrence, fatality conversion, and injury generation.
Table 3. Division-level burden and normalized risk profile.
Division | Total Accidents | Total Fatalities | Total Injuries | Mean Accident Rate 100k | Mean Fatality Rate 100k | Mean Severity Index | Mean Vehicles Per Accident |
Dhaka | 3,912 | 3,815 | 4,338 | 0.238 | 0.232 | 4.031 | 1.457 |
Chattogram | 3,340 | 3,053 | 5,088 | 0.271 | 0.248 | 4.264 | 1.449 |
Rajshahi | 2,488 | 2,390 | 1,877 | 0.332 | 0.319 | 3.720 | 1.442 |
Barishal | 1,611 | 1,523 | 2,005 | 0.480 | 0.453 | 4.350 | 0.960 |
Sylhet | 1,609 | 1,520 | 1,825 | 0.391 | 0.370 | 4.049 | 1.029 |
Khulna | 1,486 | 1,222 | 2,133 | 0.232 | 0.191 | 3.894 | 2.456 |
Mymensingh | 1,324 | 1,266 | 1,436 | 0.291 | 0.278 | 3.979 | 1.913 |
Rangpur | 1,276 | 1,205 | 1,687 | 0.197 | 0.186 | 4.334 | 2.816 |
Table 3 extends this interpretation to the division level and shows that regional burden was highly uneven. In absolute terms, Dhaka recorded the highest cumulative accident burden (3,912 accidents), followed by Chattogram (3,340) and Rajshahi (2,488). Dhaka also recorded the highest total fatalities (3,815), whereas Chattogram recorded the highest total injuries (5,088). However, the normalized risk profile differs markedly from the raw burden ranking. Barishal exhibited the highest mean accident rate per 100,000 population (0.480) and the highest mean fatality rate per 100,000 population (0.453), despite contributing fewer total accidents than Dhaka, Chattogram, or Rajshahi. Sylhet and Rajshahi also showed elevated normalized rates relative to their raw accident totals. This means that divisions with the largest cumulative burden are not necessarily the divisions with the greatest relative risk, and it highlights the need to distinguish accident volume from exposure-adjusted severity of burden.
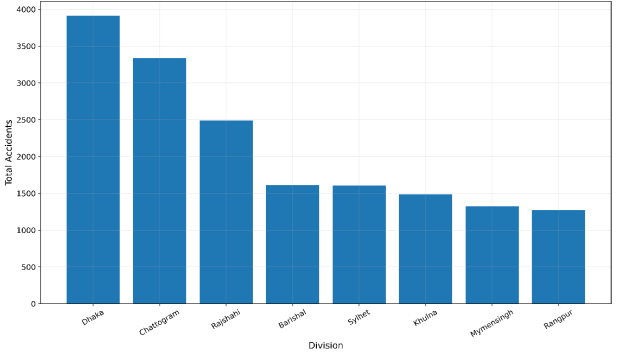
Figure 3. Division-wise cumulative accident burden across the study period.
The division-level comparison also reveals important variation in consequence intensity and vehicle involvement. Barishal had the highest mean severity index (4.350), followed closely by Rangpur (4.334) and Chattogram (4.264), indicating that the average consequence burden per accident was not spatially uniform. In contrast, Rajshahi had the lowest mean severity index (3.720), suggesting that although its total burden was high, its average accident consequence intensity was lower than that of several other divisions. The vehicles-per-accident indicator displays another important pattern. Rangpur recorded the highest mean vehicles per accident (2.816), followed by Khulna (2.456) and Mymensingh (1.913), while Barishal had the lowest value (0.960). This implies that divisions differ not only in accident volume and normalized risk, but also in the structure of crash exposure and involvement intensity. Such variation provides direct justification for the later use of exposure-adjusted count models rather than relying on raw counts alone.
Figure 3 visually reinforces the hierarchy already observed in
Table 3. The bar chart shows a steep separation between Dhaka and the rest of the country, with Chattogram forming the second tier and Rajshahi the third. The remaining divisions cluster at substantially lower total accident levels, although the differences among Barishal, Sylhet, Khulna, Mymensingh, and Rangpur is smaller in magnitude. The figure is useful because it makes the raw burden structure immediately visible: Bangladesh’s cumulative accident burden was spatially concentrated, with the largest metropolitan and high-mobility divisions carrying the greatest total number of recorded crashes. At the same time, when
Figure 3 is interpreted together with
Table 3, it becomes evident that raw concentration does not fully represent risk intensity. A division can contribute fewer accidents in total while still exhibiting a higher accident rate, fatality rate, or severity index once exposure is taken into account.
Collectively,
Tables 2, 3 and
Figure 3 show clear temporal and spatial heterogeneity in Bangladesh’s road-traffic burden. Annual accident, fatality, and injury trends differed, while division-level raw counts did not align with normalized risk. These patterns justify the use of nonlinear national models and exposure-adjusted division-level count and rate models.
4.3. Best-fitting Deterministic Equations
The deterministic modeling stage evaluated linear, quadratic, cubic, harmonic linear, and harmonic quadratic specifications to identify the most appropriate structure for each national road-traffic outcome. The comparison assessed whether a common deterministic form could explain all outcomes or whether distinct burden dimensions required different combinations of temporal drift and seasonality.
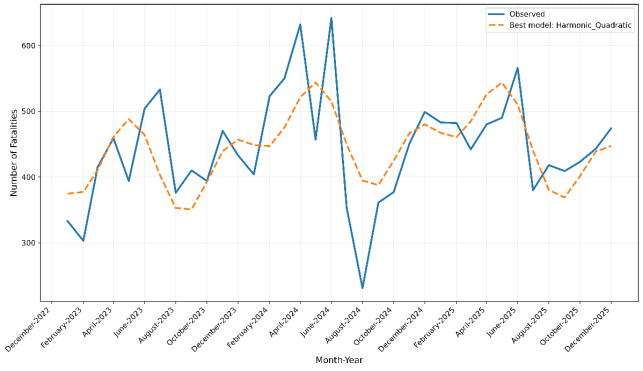
Table 4 shows that the best-fitting deterministic form differed across outcomes. Both the number of accidents and the number of fatalities were best represented by the harmonic quadratic model, with
and
, respectively. By contrast, the number of injuries was best captured by a harmonic linear model with
, while the accident severity index was best represented by a cubic model with
. The information criteria support the same conclusion. The selected accident model achieved an AIC of 427.014 and a BIC of 438.098, while the corresponding fatality model achieved an AIC of 415.625 and a BIC of 426.710. For injuries, the harmonic linear model produced an AIC of 460.912 and a BIC of 467.247, and for the severity index the cubic model yielded an AIC of 8.822 and a BIC of 15.156. Taken together, these values indicate that no single deterministic form governs the entire road-traffic burden. Instead, each outcome responds to a different combination of temporal curvature and seasonal forcing, which is itself an important substantive result.
Table 4. Best deterministic trend models by outcome.
Outcome | Best model | AIC | BIC | R² |
Number_of_Accidents | Harmonic_Quadratic | 427.014 | 438.098 | 0.385 |
Number_of_Fatalities | Harmonic_Quadratic | 415.625 | 426.710 | 0.402 |
Number_of_Injuries | Harmonic_Linear | 460.912 | 467.247 | 0.295 |
Accident_Severity_Index | Cubic | 8.822 | 15.156 | 0.250 |
The fitted national accident equation is:
(45)
This specification combines a quadratic temporal drift with annual and semiannual harmonic components. The positive linear coefficient
and negative quadratic coefficient (-0.2902) indicate that accident counts initially increased and then gradually moderated over time. The seasonal terms show that this drift operated within a strong periodic structure rather than in isolation.
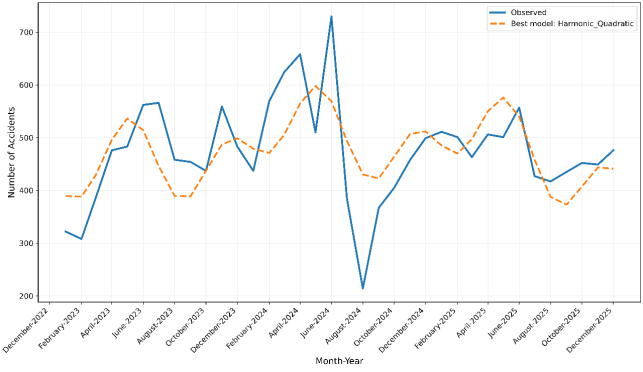
Figure 4 confirms this interpretation. The harmonic quadratic fit follows the broad rise in accident counts across 2023 and early 2024, reproduces the mid-year crest structure, and also captures the post-crest contraction that follows. Although the fitted line necessarily smooths short-run fluctuations, it reproduces the dominant deterministic pattern and therefore provides a credible representation of the underlying national accident trajectory.
Figure 4. Best deterministic fit for national monthly accidents.
Figure 5. Best deterministic fit for national monthly fatalities.
The fitted fatality equation is:
(46)
The structure of this equation closely parallels that of the accident model, which suggests that fatalities were governed by the same broad deterministic system as crash occurrence. However, the coefficients differ in magnitude, indicating that fatality burden did not merely scale proportionally with accident frequency. The lower quadratic coefficient implies a slightly smoother medium-run curvature, while the harmonic coefficients confirm strong annual and semiannual seasonal dependence.
Figure 5 supports this interpretation by showing that the fitted fatality curve tracks the observed crest-trough pattern with considerable fidelity. In particular, the model reproduces the broad mid-year elevation and the late-2024 contraction, even though it smooths the sharpest month-to-month departures. The deterministic fatality process is therefore best understood as a seasonally modulated nonlinear trajectory rather than a linear accumulation of crash consequences.
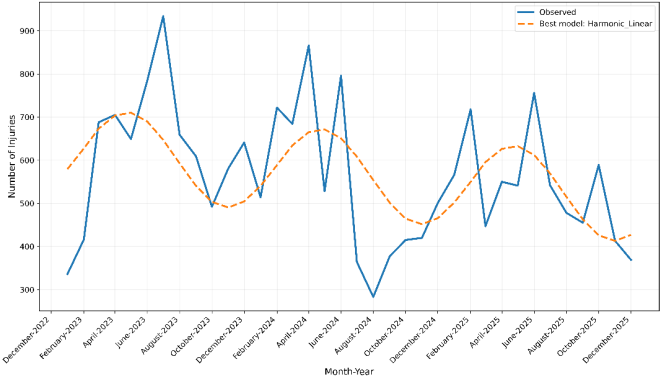
Figure 6. Best deterministic fit for national monthly injuries.
For injuries, the best-fitting equation is the harmonic linear model.
(47)
Unlike the accident and fatality equations, this model does not include a quadratic term, indicating that injuries did not require the same degree of medium-run curvature for optimal deterministic representation. The negative time coefficient (-3.2291) suggests a mild downward drift through the study period, while the two harmonic terms confirm strong recurring annual variation.
Figure 6 illustrates this clearly: the fitted injury line reproduces the major annual oscillation and the broad high-low transitions, but with smoother curvature than the observed series. The injury process therefore appears to have been more strongly driven by within-year periodicity than by pronounced nonlinear trend reversal. This distinction is consistent with the descriptive evidence, which showed that injuries declined after 2023 even though accident and fatality burdens remained comparatively elevated.
The best-fitting deterministic equation for the accident severity index was cubic:
(48)
Although its explanatory power was lower than that of the other selected models, the cubic form remains informative because it shows that severity changed dynamically over time rather than remaining mechanically fixed in proportion to accident totals. The alternating signs of the coefficients imply an initial decline, followed by partial recovery and later moderation. This means that the average consequence intensity of accidents was itself time-dependent and did not follow the same deterministic structure as the frequency outcomes. In substantive terms, Bangladesh’s road-traffic burden was governed by more than one deterministic mechanism: one for accident and fatality occurrence, another for injury oscillation, and yet another for average consequence intensity.
Figures 4-6 confirm that the deterministic structure is outcome-specific. Harmonic quadratic models capture the nonlinear and seasonal behavior of accidents and fatalities, while the harmonic linear model adequately represents the cyclical injury pattern. Overall, the fitted models recover the dominant temporal and seasonal structure without attempting to reproduce short-term fluctuations.
Overall,
Table 4 and
Figures 4-6 show that Bangladesh’s national accident dynamics are outcome-specific. Accidents and fatalities are best described by harmonic quadratic models, injuries by a harmonic linear model, and severity by a cubic model. This confirms that the burden is driven by distinct combinations of nonlinear trend and seasonality, supporting the use of a layered mathematical framework.
4.4. Seasonal Structure and Stochastic Dependence
The deterministic models identified strong seasonality in Bangladesh’s national accident burden. To verify its robustness and persistence, seasonal-index analysis and seasonal time-series forecasting were applied jointly, combining nonparametric monthly pattern assessment with stochastic modeling of serial dependence and future seasonal recurrence.
Table 5. Seasonal-index peaks and troughs.
Outcome | Peak month | Peak index | Trough month | Trough index |
Accidents | June | 1.302 | August | 0.767 |
Fatalities | June | 1.284 | August | 0.769 |
Injuries | June | 1.375 | November | 0.832 |
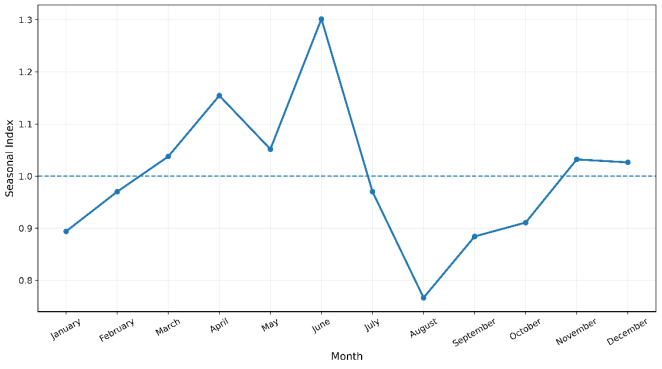
Table 5 summarizes the seasonal-index peaks and troughs for the principal national burden variables. The results show a remarkably coherent seasonal structure. For accidents, the peak month was June, with a seasonal index of 1.302, while the trough month was August, with a seasonal index of 0.767. For fatalities, the same pattern was observed: June produced the highest seasonal index (1.284), whereas August produced the lowest (0.769). For injuries, the peak also occurred in June, and the corresponding seasonal index was even larger (1.375), indicating a stronger mid-year elevation than that observed for accidents or fatalities. The trough for injuries, however, shifted to November, with a seasonal index of 0.832. This distinction is important because it suggests that injury burden, although synchronized with the broader annual cycle, does not contract at exactly the same point in the calendar as accident and fatality counts. In substantive terms,
Table 5 confirms that the seasonal process is not random noise; it is a stable and interpretable feature of the national road-traffic system.
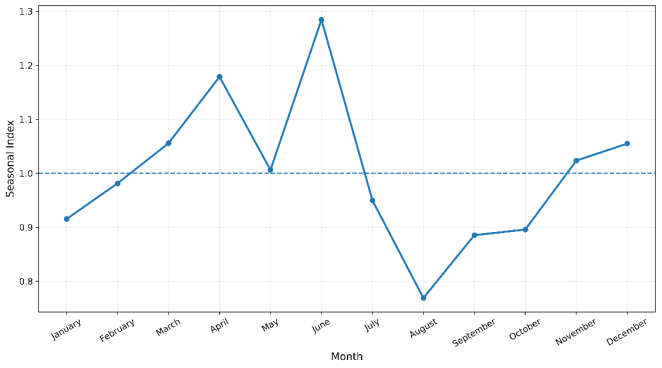
Figures 7 and 8 provide a graphical interpretation of the same seasonal-index evidence for accidents and fatalities. In
Figure 7, the accident seasonal-index curve rises progressively from the early months of the year, crosses above the unit reference line by March, and reaches its maximum in June. This means that accident counts during June were approximately 30.2% above the overall monthly average. The curve then declines sharply, falling below unity in July and reaching its lowest point in August, when accident burden was approximately 23.3% below the average monthly level. Thereafter, the index gradually recovers, returning to values close to or slightly above unity toward the end of the year.
Figure 8 shows an almost identical temporal architecture for fatalities. Fatality burden rises from below-average levels in the early months to a June peak approximately 28.4% above the monthly average, then contracts sharply to an August through approximately 23.1% below average. The close correspondence between
Figures 7 and 8 indicates that accident occurrence and fatal consequence burden were governed by the same broad seasonal system. This graphical alignment also reinforces the harmonic regression findings reported earlier, but unlike harmonic regression, the seasonal-index method does not impose a parametric sinusoidal structure. The agreement between the two therefore strengthens confidence that the observed seasonality is genuine rather than an artifact of model specification.
Figure 7. Seasonal index of national monthly accidents.
Figure 8. Seasonal index of national monthly fatalities.
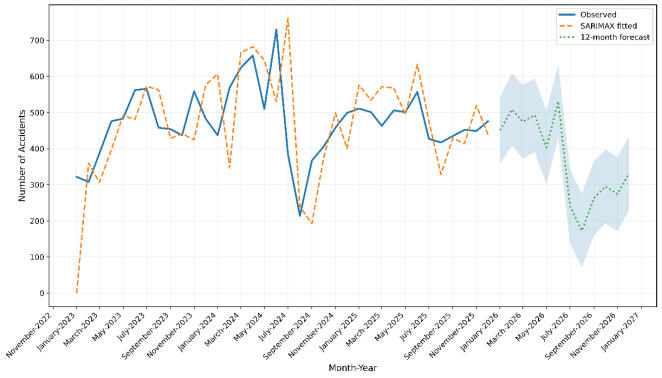
Figure 9. SARIMAX forecast for national monthly accidents with confidence limits.
The stochastic time-series evidence leads to the same conclusion.
Figure 9 presents the SARIMAX fit and forecast for national monthly accident counts, together with confidence limits. The in-sample fitted values reproduce the broad temporal movement of the observed series, including the strong oscillatory pattern and the sharp contraction following the 2024 crest. More importantly, the post-sample forecast preserves a clear 12-month seasonal memory, indicating that the annual accident cycle identified in the historical data continues to shape the projected path. The forecasted series shows a renewed crest in June-2026, with 531.074 forecast accidents, followed by a sharp decline to a trough in August-2026, with 172.717 forecast accidents. Thus, the same mid-year intensification and late-monsoon contraction observed during the estimation period is projected to reappear in the post-sample horizon. Although the confidence band widens as the forecast extends further into the future, the central path remains strongly seasonal, which implies that the annual cycle is not only descriptive but predictive.
From a methodological standpoint, the seasonal-index results and SARIMAX forecast complement one another in a highly informative way. The seasonal indices identify the months that systematically lie above or below the long-run average, while the SARIMAX model shows that these recurring departures are embedded within a stochastic dependence structure with persistent annual memory. This means that Bangladesh’s road-traffic accident burden is not merely seasonal in a descriptive sense; it is seasonally reproducible in a predictive sense as well. In practical terms, the recurrence of June peaks and August troughs suggests that preventive measures, traffic monitoring, and emergency preparedness should be aligned with the calendar structure of risk rather than distributed uniformly across the year.
Taken together,
Table 5 and
Figures 7-9 confirm a persistent seasonal structure in Bangladesh’s road-traffic burden. Seasonal indices identify stable peak and trough months, while SARIMAX shows that this annual pattern persists into the forecast period. The agreement across deterministic, seasonal, and stochastic models indicates a recurring mid-year peak followed by a later decline, with clear implications for both modeling and road-safety planning.
4.5. Exposure-adjusted Count Modelling and Normalized Fatality Risk
The preceding analyses revealed substantial temporal and regional heterogeneity in road-traffic burden. To evaluate this structure inferentially, division-month accident counts were modeled using exposure-adjusted Poisson and negative binomial regression, while normalized fatality risk was assessed through a harmonic OLS model. This approach tests whether accident incidence and fatalities per 100,000 population can be explained systematically after accounting for exposure, regional characteristics, and seasonality.
Table 6. Count-model comparison for division-month accident incidence.
Model | AIC | BIC | LogLik |
Poisson | 3173.859 | 3210.489 | -1576.929 |
Negative Binomial | 2898.301 | 2934.931 | -1439.151 |
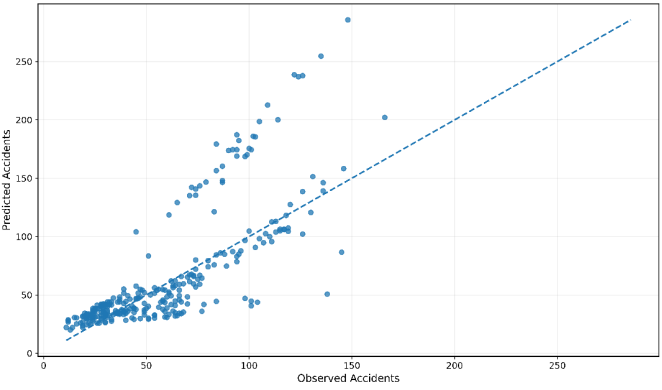
Table 6 shows that the negative binomial model clearly outperformed the Poisson model for division-month accident counts, with lower AIC (2898.301 vs. 3173.859), lower BIC (2934.931 vs. 3210.489), and higher log-likelihood (−1439.151 vs. −1576.929). The 275.558-point AIC improvement provides strong evidence of overdispersion, indicating that the Poisson equidispersion assumption is inappropriate for the Bangladesh accident panel.
Figure 10 supports this result by showing a clear positive relationship between observed and predicted counts under the negative binomial model. Although dispersion increases at higher accident levels, the model captures the main incidence pattern across low-, medium-, and high-burden observations, supporting its suitability for exposure-adjusted accident modeling.
Figure 10. Observed versus predicted accident counts under the negative binomial model.
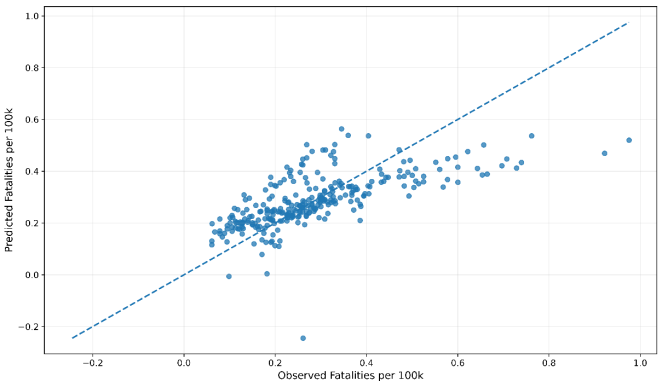
Table 7 shows that the harmonic OLS fatality-rate model explained 46.1% of the variation in fatalities per 100,000 population. The model was highly significant, with AIC and BIC values of −433.804 and −397.175, respectively. These results indicate that normalized fatality risk has a statistically meaningful structure once exposure, regional characteristics, and seasonal effects are incorporated.
Table 7. OLS harmonic fatality-rate model diagnostics.
Statistic | Value |
R_squared | 0.460727 |
Adj_R_squared | 0.443268 |
F_statistic | 26.389828 |
F_pvalue | 0.000000 |
AIC | -433.804445 |
BIC | -397.174840 |
Figure 10 provides the graphical counterpart to
Table 7 by comparing observed and predicted fatalities per 100,000 population under the harmonic OLS model. The scatter points are concentrated along an upward-sloping pattern, indicating broad agreement between observed and fitted normalized fatality values. The alignment is strongest in the central portion of the distribution, where most observations cluster, while greater dispersion is visible at the higher end of the fatality-rate scale. This is a typical feature of applied rate modeling in heterogeneous regional data and does not weaken the substantive result.
Figure 11. Observed versus predicted fatalities per 100,000 population under the harmonic OLS model.
On the contrary, the
Figure 11 shows that the model captures the main gradient of normalized fatality risk without reducing all divisions and months to a uniform fitted average. In policy terms, this is important because it means that variation in fatality burden across divisions is not merely a consequence of size differences; it reflects interpretable structure linked to exposure, accident burden, and seasonality.
4.6. Integrated Interpretation
The results collectively indicate that road-traffic accident burden in Bangladesh is governed by the interaction of nonlinear temporal dynamics, recurring seasonality, exposure heterogeneity, and consequence severity, rather than by a single underlying process. The integrated framework is therefore necessary because each model captures a different structural component of the accident system.
At the national level, accidents and fatalities were best represented by harmonic quadratic models, injuries by a harmonic linear model, and the severity index by a cubic model. This confirms that crash frequency, fatality burden, injury burden, and severity follow distinct temporal patterns. Seasonal analysis further identified June as the dominant peak month, while August represented the principal trough for accidents and fatalities. The SARIMAX results preserved this 12-month recurrence, indicating that the seasonal structure is both statistically persistent and predictive.
At the regional level, raw accident burden and normalized risk differed substantially. Dhaka and Chattogram recorded the largest total accident counts, whereas Barishal exhibited the highest population-adjusted accident and fatality rates. This divergence demonstrates the importance of exposure adjustment when comparing divisions of different population and mobility characteristics.
The negative binomial model clearly outperformed the Poisson specification, confirming substantial overdispersion in division-month accident counts. This suggests that regional accident incidence contains unobserved heterogeneity and variability that cannot be represented adequately by an equidispersed count process. Similarly, the normalized fatality-rate model showed that fatality risk has a systematic explanatory structure once exposure, regional characteristics, and seasonality are incorporated.
Overall, the findings support a multilayered interpretation of road-traffic burden in Bangladesh. National trends are nonlinear and seasonal, regional incidence is exposure-sensitive and overdispersed, and consequence severity follows a distinct risk structure. From a policy perspective, road-safety interventions should therefore combine seasonally targeted prevention, exposure-adjusted regional prioritization, and separate monitoring of accident frequency and fatality severity.
5. Findings, Limitations and Future Works
5.1. Findings
These complementary results provide a coherent basis for interpreting the temporal, spatial, and exposure-related dimensions of road-traffic risk. The key findings are summarized as follows.
i. Bangladesh experienced a persistently high national road-traffic burden over the study period, with 17,046 accidents, 15,994 fatalities, 20,389 injuries, and 36,383 casualties recorded over 36 months. This confirms that the accident system was both substantial in magnitude and materially variable over time.
ii. The annual burden did not evolve monotonically. Accident totals increased from 5,495 in 2023 to 5,856 in 2024 before moderating to 5,695 in 2025, while fatalities rose from 5,024 in 2023 to 5,480 in 2024 and remained high at 5,490 in 2025. This temporal pattern supports the use of nonlinear deterministic models rather than a simple linear trend.
iii. The best-fitting deterministic structure differed across outcomes, indicating that no single functional form governs the entire accident system. National accidents and fatalities were best represented by harmonic quadratic models, injuries by a harmonic linear model, and the accident severity index by a cubic model. This result shows that the different burden dimensions respond to distinct combinations of temporal drift and seasonal forcing.
iv. The national accident and fatality series were both characterized by a rising-then-moderating pattern under strong annual and semiannual seasonal influence. This indicates that accident occurrence and fatality burden were governed by the same broad seasonal system, although not with identical amplitude or response intensity.
v. The injury series followed a different deterministic structure, with recurring annual oscillation playing a stronger role than medium-run nonlinear curvature. This suggests that injury burden was seasonally recurrent but less strongly driven by the same medium-run trajectory that shaped accident and fatality counts.
vi. The accident severity index changed dynamically across the study period rather than remaining mechanically proportional to accident frequency. This shows that the consequence intensity of crashes evolved over time and should therefore be modeled separately from raw accident totals.
vii. Seasonal-index analysis revealed a clear and stable calendar structure. June was the peak month for accidents, fatalities, and injuries, whereas August was the trough month for accidents and fatalities and November was the trough month for injuries. This confirms that the Bangladesh accident system is seasonally recurrent rather than temporally uniform.
viii. Division-level raw burden and population-normalized risk did not coincide. Dhaka and Chattogram recorded the largest cumulative accident totals, but Barishal exhibited the highest mean accident and fatality rates per 100,000 population. This demonstrates that the divisions with the greatest raw burden are not necessarily the divisions with the highest relative risk.
ix. Division-month accident counts were substantially over dispersed. The negative binomial model outperformed the Poisson model by improving the AIC by 275.558 points, indicating that equidispersion assumptions are inappropriate for the Bangladesh regional accident panel.
x. Within the exposure-adjusted count framework, vehicles involved and vehicles per accident remained important predictors of accident incidence. This demonstrates that mobility-related exposure is a major determinant of crash burden even after adjustment for population size and division-level structural characteristics.
xi. The harmonic OLS fatality-rate model explained 46.1% of the variation in fatalities per 100,000 population, confirming that normalized fatality burden has a meaningful explanatory structure linked to accident volume, exposure, division characteristics, and seasonality.
xii. Seasonal stochastic forecasting through SARIMAX preserved a strong 12-month seasonal memory and projected a renewed accident crest in June-2026 and a trough in August-2026, implying that the observed seasonal cycle is likely to persist beyond the estimation period.
5.2. Limitations
The main limitations of the study are as follows:
i. The 36-month study period limits assessment of long-term structural changes.
ii. Secondary administrative data may contain underreporting, delays, or measurement inconsistencies.
iii. Important factors such as weather, road geometry, traffic speed, enforcement, and driver behavior were not included.
5.3. Future Works
The findings suggest several directions for future research:
i. Incorporate weather, roadway, traffic, enforcement, land-use, and behavioral factors.
ii. Extend the framework to spatial and spatio-temporal models for regional dependence and clustering.
iii. Compare the current models with Bayesian, spatial negative binomial, and advanced forecasting approaches.
6. Conclusions
This study developed an integrated mathematical framework for road-traffic accident analysis in Bangladesh by combining nonlinear deterministic modeling, exposure-adjusted count regression, normalized fatality-rate analysis, and seasonal time-series forecasting. The findings demonstrate that accident burden is governed by interacting temporal, seasonal, exposure-related, and stochastic mechanisms rather than by a single uniform process. National accidents and fatalities were best represented by harmonic quadratic models, injuries by a harmonic linear model, and the severity index by a cubic specification, confirming that different burden dimensions follow distinct structural trajectories. At the division level, the negative binomial model substantially outperformed the Poisson model, indicating pronounced overdispersion in accident counts, while the normalized fatality-rate model showed that fatality risk can be meaningfully explained after accounting for exposure, regional characteristics, and seasonality. Overall, the results support interpreting road accidents in Bangladesh as a structured dynamic system rather than as isolated monthly events. The proposed framework therefore provides a mathematically coherent and policy-relevant basis for seasonal surveillance, exposure-adjusted regional risk assessment, and evidence-based road-safety planning.
Abbreviations
BBS | Bangladesh Bureau of Statistics |
BRTA | Bangladesh Road Transport Authority |
Acknowledgments
The authors gratefully acknowledge the Department of Civil Engineering, Ahsanullah University of Science and Technology (AUST), Dhaka, Bangladesh, for providing academic guidance, research support, and a conducive environment for conducting this study. The authors also acknowledge the BRTA and BBS for making the official road accident and population statistics publicly available, which formed the basis of this research.
Author Contributions
Sree Pradip Kumer Sarker: Conceptualization, Data curation, Formal Analysis, Investigation, Methodology, Resources, Software, Validation, Visualization, Writing – original draft, Writing – review & editing
Md. Shahid Mamun: Conceptualization, Methodology, Supervision, Writing – review & editing
Data Availability Statement
The data supporting the findings of this study are included within the article in the form of tables and figures. The processed datasets used for analysis were compiled from publicly available official statistics published by the Bangladesh Road Transport Authority (BRTA) and BBS population statistics. No additional datasets were generated beyond those presented in this manuscript.
Conflicts of Interest
The authors declare no conflicts of interest.
References
| [1] |
Keshav Bamel, Saurabh Jaglan, Sachin Dass, Karuna Bamel, Amir Ali Khan, Parveen Berwal and Nakul Gupta, “Mathematical Modeling Analysis of India's Accident & Use of Fly Ash and Polymers in Road Safety,” Journal of Polymer & Composites 13 (2025), S488-S499.
|
| [2] |
A. Venkata Kiran, T. Kiran Sai Pavan, S. Tanuj Reddy and S. Suchitra, “Predictive Modeling of Traffic Accidents: A Data-Driven Approach,” in G. Dilip et al. (eds.), Proceedings of the International Conference on Intelligent Systems and Digital Transformation (ICISD 2025), Atlantis Highlights in Intelligent Systems, Vol. 15, 2025.
|
| [3] |
Edmund F. Agyemang, Joseph A. Mensah, Eric Ocran, Enoch Opoku and Ezekiel N. N. Nortey, “Time series based road traffic accidents forecasting via SARIMA and Facebook Prophet model with potential changepoints,” Heliyon 9 (2023), e22544.
|
| [4] |
Taqwa Alhadidi and Mohammed Elhenawey, “Modeling Crashes Severity Using Ensemble Techniques,” The Eurasia Proceedings of Science, Technology, Engineering & Mathematics 26 (2023), 357-365.
|
| [5] |
Ankona Biswas, Kefayat Tasnim and Md. Haider Ali Biswas, “Mathematical Modeling Applied to Assess the Driving Factors of Increasing Road Accidents in Bangladesh,” Khulna University Studies, Special Issue ICSTEM4IR (2022), 757-767.
|
| [6] |
Md. Kamrul Khan and Md. Tarek Hasan, “A Poisson Regression Approach to Modeling Traffic Accident Frequency in Urban Areas,” American Journal of Interdisciplinary Studies 3 (2022), 117-156.
|
| [7] |
Natalya Alexandrovna Naumova, “Application of Mathematical Modeling Methods for Operational Optimization of Urban Traffic in an Accident on a Section of the Road Network,” Civil Engineering and Architecture 9 (2021), 2140-2146.
|
| [8] |
Kefayat Tasnim, Ankona Biswas and Md. Haider Ali Biswas, “Mathematical Approach to Assess the Severity of Road Accidents in Bangladesh Using a SEIR-type Model,” Proceedings of the International Conference on Industrial & Mechanical Engineering and Operations Management, Dhaka, Bangladesh, 2020.
|
| [9] |
Xi Jianfeng, Guo Hongyu, Tian Jian, Lisa Liu and Liu Haizhu, “A classification and recognition model for the severity of road traffic accident,” Advances in Mechanical Engineering 11 (2019), 1-8.
|
| [10] |
Azad Abdulhafedh, “Road Crash Prediction Models: Different Statistical Modeling Approaches,” Journal of Transportation Technologies 7 (2017), 190-205.
|
| [11] |
Roman Ondrejka and Lenka Moravčíková, “Mathematical Modelling within the Road Safety Management,” Acta Technológia 1 (2015), 5-8.
|
| [12] |
Witold Pawlus, Kjell Gunnar Robbersmyr and Hamid Reza Karimi, “Mathematical modeling and parameters estimation of a car crash using data-based regressive model approach,” Applied Mathematical Modelling 35 (2011), 5091-5107.
|
| [13] |
Witold Pawlus, Jan Eivind Nielsen, Hamid Reza Karimi and Kjell Gunnar Robbersmyr, “Development of Mathematical Models for Analysis of a Vehicle Crash,” WSEAS Transactions on Applied and Theoretical Mechanics 5 (2010).
|
Cite This Article
-
APA Style
Sarker, S. P. K., Mamun, M. S. (2026). Mathematical Modeling for Road Accident Analysis in Bangladesh: Nonlinear Deterministic, Exposure-Adjusted Count, and Seasonal Time-Series Approaches. International Journal of Transportation Engineering and Technology, 12(3), 98-118. https://doi.org/10.11648/j.ijtet.20261203.12
 Copy
|
Copy
|
 Download
ACS Style
Sarker, S. P. K.; Mamun, M. S. Mathematical Modeling for Road Accident Analysis in Bangladesh: Nonlinear Deterministic, Exposure-Adjusted Count, and Seasonal Time-Series Approaches. Int. J. Transp. Eng. Technol. 2026, 12(3), 98-118. doi: 10.11648/j.ijtet.20261203.12
Copy
|
Download
AMA Style
Sarker SPK, Mamun MS. Mathematical Modeling for Road Accident Analysis in Bangladesh: Nonlinear Deterministic, Exposure-Adjusted Count, and Seasonal Time-Series Approaches. Int J Transp Eng Technol. 2026;12(3):98-118. doi: 10.11648/j.ijtet.20261203.12
Copy
|
Download
-
@article{10.11648/j.ijtet.20261203.12,
  author = {Sree Pradip Kumer Sarker and Md. Shahid Mamun},
  title = {Mathematical Modeling for Road Accident Analysis in Bangladesh: Nonlinear Deterministic, Exposure-Adjusted Count, and Seasonal Time-Series Approaches},
  journal = {International Journal of Transportation Engineering and Technology},
  volume = {12},
  number = {3},
  pages = {98-118},
  doi = {10.11648/j.ijtet.20261203.12},
  url = {https://doi.org/10.11648/j.ijtet.20261203.12},
  eprint = {https://article.sciencepublishinggroup.com/pdf/10.11648.j.ijtet.20261203.12},
  abstract = {This study establishes a coherent mathematical model for the investigation of road accidents in Bangladesh by integrating nonlinear deterministic modeling, count regression with exposure, normalized fatality-rate estimation and seasonal time-series forecasting. The analysis constructs a balanced monthly panel from January 2023 to December 2025, with 36 national monthly observations and 288 division-month observations, using four synchronized datasets on population, monthly accidents, fatalities by type of vehicle, and vehicle involvement. During the study period, Bangladesh recorded 17,046 accidents, 15,994 deaths, 20,389 injuries and 36,383 total casualties indicating a persistently high and fluctuating national toll. Analysis of the deterministic model shows that harmonic quadratic equations best describe the accidents and fatalities, a harmonic linear equation the injuries, and a cubic equation the accident severity index, confirming the absence of any single common trend structure across the burden dimensions. Seasonal-index analysis revealed that June is the month with the highest number of accidents, fatalities and injuries, while August is the lowest month for accidents and fatalities and November for injuries, indicating consistent annual patterns. At the division-month level, the negative binomial model is significantly better than the Poisson model, reducing the AIC by 275.558 points, indicating significant overdispersion in accident occurrences. The harmonic OLS model for the fatality rate accounts for 46.1% of the variation in fatalities per 100,000 individuals. The SARIMAX forecast has a 12-month seasonal memory and projects a rise in June 2026 and a fall in August 2026. The results suggest that the incidence of road accidents in Bangladesh is influenced by nonlinear trends, seasonal variations, exposure disparities, and random temporal correlations, providing a mathematically coherent basis for risk assessment and road safety strategies.},
 year = {2026}
}
Copy
|
Download
-
TY  - JOUR
T1  - Mathematical Modeling for Road Accident Analysis in Bangladesh: Nonlinear Deterministic, Exposure-Adjusted Count, and Seasonal Time-Series Approaches
AU  - Sree Pradip Kumer Sarker
AU  - Md. Shahid Mamun
Y1  - 2026/08/24
PY  - 2026
N1  - https://doi.org/10.11648/j.ijtet.20261203.12
DO  - 10.11648/j.ijtet.20261203.12
T2  - International Journal of Transportation Engineering and Technology
JF  - International Journal of Transportation Engineering and Technology
JO  - International Journal of Transportation Engineering and Technology
SP  - 98
EP  - 118
PB  - Science Publishing Group
SN  - 2575-1751
UR  - https://doi.org/10.11648/j.ijtet.20261203.12
AB  - This study establishes a coherent mathematical model for the investigation of road accidents in Bangladesh by integrating nonlinear deterministic modeling, count regression with exposure, normalized fatality-rate estimation and seasonal time-series forecasting. The analysis constructs a balanced monthly panel from January 2023 to December 2025, with 36 national monthly observations and 288 division-month observations, using four synchronized datasets on population, monthly accidents, fatalities by type of vehicle, and vehicle involvement. During the study period, Bangladesh recorded 17,046 accidents, 15,994 deaths, 20,389 injuries and 36,383 total casualties indicating a persistently high and fluctuating national toll. Analysis of the deterministic model shows that harmonic quadratic equations best describe the accidents and fatalities, a harmonic linear equation the injuries, and a cubic equation the accident severity index, confirming the absence of any single common trend structure across the burden dimensions. Seasonal-index analysis revealed that June is the month with the highest number of accidents, fatalities and injuries, while August is the lowest month for accidents and fatalities and November for injuries, indicating consistent annual patterns. At the division-month level, the negative binomial model is significantly better than the Poisson model, reducing the AIC by 275.558 points, indicating significant overdispersion in accident occurrences. The harmonic OLS model for the fatality rate accounts for 46.1% of the variation in fatalities per 100,000 individuals. The SARIMAX forecast has a 12-month seasonal memory and projects a rise in June 2026 and a fall in August 2026. The results suggest that the incidence of road accidents in Bangladesh is influenced by nonlinear trends, seasonal variations, exposure disparities, and random temporal correlations, providing a mathematically coherent basis for risk assessment and road safety strategies.
VL  - 12
IS  - 3
ER  -
Copy
|
Download







 Share This Article
 Twitter
 Linked In
 Facebook