Abstract
Efficient toll plaza operations are critical to minimizing congestion and travel delay on high-volume highway corridors. This study investigates the operational performance of a major toll plaza on National Highway-75 (NH-75), India, using queueing theory–based analytical models. Field data were collected at the Neelmangala–Devihalli Toll Plaza, including traffic volume, time headway, arrival rates, service times, and space mean speeds under mixed traffic conditions. Statistical analysis confirms that vehicle arrivals follow a Poisson process, while service times exhibit a general distribution, justifying the application of both M/M/1 and M/G/1 queueing models. Key performance indicators such as system utilization, average queue length, and vehicle waiting time were derived to evaluate toll booth efficiency during peak and off-peak periods. The results indicate that congestion is primarily driven by high arrival rates during peak hours, limited toll booth capacity, and downstream lane merging constraints rather than insufficient roadway capacity. The analysis further demonstrates that the adoption of electronic toll collection (FASTag), optimized lane allocation, and selective booth expansion can significantly reduce average waiting times and improve throughput. This research highlights the practical applicability of queueing theory as a decision-support framework for diagnosing operational bottlenecks and guiding data-driven improvements in toll plaza planning and management on Indian highways.
Keywords
Toll Plaza Operations, Queueing Theory, M/M/1 Model, M/G/1 Model, Poisson Arrival Process, Service Rate Analysis,
Traffic Flow Optimization, Arrival Rate Modeling
1. Introduction
Toll plaza congestion is a persistent challenge in highway transportation systems, especially in developing economies with rapidly increasing vehicular traffic
| [1] | Sangavi, G. V., Megha, G. C., Application of Queuing Theory to a Toll Plaza – A Case Study, IJERT., Ref Url:
https://www.ijert.org/research/application-of-queuing-theory-of-a-toll-plaza-a-case-study-IJERTV6IS060202.pdf |
| [3] | Kavin Malar, K., Gogula Chezhiyan, N., Design of Toll Plaza – A Case Study, MATEC Conf., Ref Url:
https://doi.org/10.1051/matecconf/202440003008 |
[1, 3]
. This research presents a queueing model-based approach to optimize toll booth operations, addressing inefficiencies such as long waiting times
, peak-hour congestion, and lane merging delays
| [7] | Adan, I., Boxma, O., Resing, J., Queueing Models with Multiple Waiting Lines.,
https://doi.org/10.1023/A:1011040100856 |
| [8] | MathWorks, M/M/1 Queueing System, Ref Url:
https://in.mathworks.com/help/simevents/ug/m-m-1-queuing-system.html |
| [9] | Vandaele, N., A Queueing-Based Traffic Flow Model,
https://doi.org/10.1016/S1361-9209(99)00028-0 |
[7-9]
. By applying queueing theory, vehicle arrival patterns, service times, and queue lengths are analyzed to improve toll plaza efficiency and operational decision-making
.
1.1. General
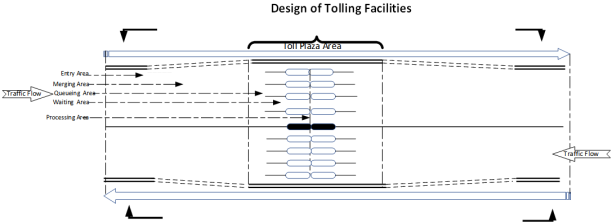
Modern toll plazas are designed with designated lanes [
Figure 1], vehicle classification mechanisms, and multiple payment options to streamline toll collection
. Electronic Toll Collection (ETC) systems such as FASTag, based on RFID technology, enable seamless toll transactions and significantly reduce processing time compared to manual cash collection
. Despite these improvements, queue formation and merging conflicts during peak hours continue to cause delays, particularly near lane convergence zones
.
Toll Collection Methods:
Toll plaza operations combine manual and automated processes to ensure efficient, transparent, and reliable toll collection. Cash payments
involve booth-based transactions with receipt issuance, while Electronic Toll Collection (ETC) and RFID-based systems enable seamless, contactless toll deductions to reduce waiting times
. Toll booth operators and traffic management strategies, such as lane prioritization
, help maintain smooth vehicle flow and minimize congestion. Toll ticket validation ensures payment accuracy, while regular auditing and revenue management safeguard financial integrity and prevent fraud. Routine maintenance of toll booths, software, and road infrastructure supports uninterrupted operations, and customer service mechanisms address user inquiries and grievances, enhancing overall commuter satisfaction and operational efficiency. These processes ensure efficient, transparent, and user-friendly toll operation.
Figure 1. Design of Tolling Facilities.
Table 1. Modern toll facilities, NH 648 Hosur and 748 Neelmangala, Bengaluru, Karnataka, India.
Sl. No. | Sl No. in Schedule to NH Act 1956 | New NH No. | Description | Old NH No. | State | Length (km) |
287 | 164 | 648 | The highway starting from its junction with NH 48 near Neelamangala, Doddaballapur, Devihalli on NH 44, Sarjapur in Karnataka, Bagalur and terminating at its junction with NH 48 near Hosur in Tamil Nadu. | 207 | Karnataka | 121.52 |
Tamil Nadu | 19 |
288 | 165 | 748 | The highway starts from its junction with NH 48 near Belgaum, Anmod in Karnataka, Panda and terminating at its junction with NH 66 near Panaji in Goa | 4A | Goa | 69.55 |
Karnataka | 84.12 |
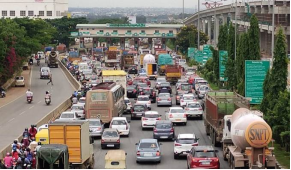
While the implementation of RFID-enabled toll payment systems offers numerous advantages, certain drawbacks persist, particularly during peak hours. During these times, vehicles queue up to access to toll booths, and after making their payments, drivers often face delays as they jostle for position when multiple lanes merge back into the original road width near the toll plaza. Research conducted at two toll plazas “Hosur and Neelmangala” located in the urban area of Bengaluru, Karnataka, provides insights into these challenges [
Figure 2,
Table 1]. The analysis suggests that implementing this technology can save an estimated 7 minutes of travel per vehicle, potentially benefiting over ten vehicles per minute. Additionally, this optimization could support the removal of one toll gate and the adjacent service lane area
running parallel to the highway, further streamlining traffic flow.
1.2. Background
Congestion at toll plazas arises from mismatched toll gate capacity, variable service times, human intervention, and uneven traffic inflow, often resulting in delays of 15–30 minutes during peak hours on national highways
| [1] | Sangavi, G. V., Megha, G. C., Application of Queuing Theory to a Toll Plaza – A Case Study, IJERT., Ref Url:
https://www.ijert.org/research/application-of-queuing-theory-of-a-toll-plaza-a-case-study-IJERTV6IS060202.pdf |
| [3] | Kavin Malar, K., Gogula Chezhiyan, N., Design of Toll Plaza – A Case Study, MATEC Conf., Ref Url:
https://doi.org/10.1051/matecconf/202440003008 |
[1, 3]
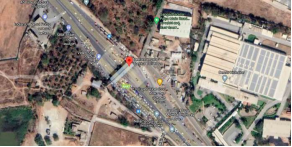
. Prior studies show that real-time monitoring [
Figure 3], dedicated ETC lanes, and optimized queue management can substantially improve traffic flow without increasing infrastructure costs
.
1.3. Scope of Research
This study focuses on analyzing geometric design, traffic arrival behavior, service characteristics, and queuing dynamics at toll plazas
. Understanding these patterns is essential for optimizing toll booth capacity, reducing waiting times, and improving revenue efficiency for highway authorities
.
Toll plazas have become a critical means of revenue generation for the Ministry of Transport, India, supporting the National Highways Authority and State Highway Transportation Authorities. Elevated and express highways, as well as private highways, have recently been integrated with the FASTag system for seamless toll fee collection. Understanding queuing patterns is vital to developing methods for optimizing toll plaza layouts and operations
. This includes improving service rates at toll booths, increasing capacity, and reducing long vehicle queues.
Doddakarenahalli (Neelmangala) (BOT (Toll))
Km 32.600 – NH-75 in Karnataka
Stretch: Neelmangala Junction to Devihalli Tollable
Length: 40.131 Km(s)
Figure 3. Neelmangala Toll Plaza Live Traffic Monitoring.
1.4. Methodology
The methodology integrates field data collection with analytical modeling through M/M/1 and M/G/1 queueing frameworks
| [7] | Adan, I., Boxma, O., Resing, J., Queueing Models with Multiple Waiting Lines.,
https://doi.org/10.1023/A:1011040100856 |
| [8] | MathWorks, M/M/1 Queueing System, Ref Url:
https://in.mathworks.com/help/simevents/ug/m-m-1-queuing-system.html |
| [9] | Vandaele, N., A Queueing-Based Traffic Flow Model,
https://doi.org/10.1016/S1361-9209(99)00028-0 |
| [14] | M/G/1 Queue, ScienceDirect., Ref Url:
https://www.sciencedirect.com/topics/computer-science/m-g-1-queue |
[7-9, 14]
. Traffic volume, interarrival time, service time, and lane utilization were measured and statistically analyzed to evaluate toll booth performance
| [3] | Kavin Malar, K., Gogula Chezhiyan, N., Design of Toll Plaza – A Case Study, MATEC Conf., Ref Url:
https://doi.org/10.1051/matecconf/202440003008 |
| [6] | Korstanje, J., Waiting Line Models., Ref Url:
https://web.uettaxila.edu.pk/CMS/AUT2013/ieORbs/notes/Chapter%20-%20Waiting%20Line%20Models.pdf |
| [11] | Mathew, T. V., Traffic Stream Models, IIT Bombay, Ref Url:
https://www.civil.iitb.ac.in/tvm/nptel/513_TrStream/web/web.html |
[3, 6, 11]
[
Figures 4, 5].
Toll Collection Booths: Toll collection at plazas is carried out through a combination of manual toll booths, where toll collectors handle cash transactions and issue receipts, and Electronic Toll Collection (ETC) systems such as FASTag, which enable automated, contactless toll processing to improve efficiency and reduce vehicle waiting times.
Toll Rates: Toll charges are determined based on multiple vehicle and usage-related parameters to ensure fairness, consistency, and proportional cost recovery. The type of vehicle, such as passenger cars, buses, or trucks, is a primary factor, as different vehicle categories impose varying levels of load and wear on road infrastructure. Additionally, vehicle size and the number of axles is used to classify vehicles more precisely, since heavier and multi axle vehicles contribute to higher pavement stress and maintenance requirements. In the case of distance-based or closed toll systems, the distance traveled on the tolled roadway is also considered, with toll fees calculated accordingly to reflect actual road usage.
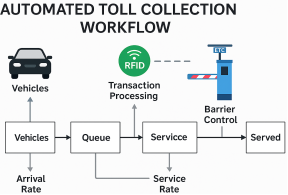
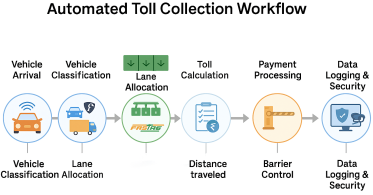
Toll Collection Methods: In India, toll collection methods have evolved to enhance efficiency, transparency, and traffic flow while reducing manual intervention
. Cash payment, though now limited, is still permitted at selected toll plazas, where toll collectors manually accept cash, issue printed receipts and provide change to motorists. However, the primary and widely adopted method is FASTag based Electronic Toll Collection (ETC), which uses RFID technology to automatically deduct toll charges from a prepaid or linked bank account as vehicles pass through designated lanes. FASTag enables nonstop tolling, significantly reduces waiting time, minimizes congestion at toll plazas, lowers fuel consumption, and supports digital payment initiatives under India’s smart transportation framework. The Government of India has mandated FASTag usage across national highways, making it the dominant and most effective toll collection mechanism in the country today [
Figure 4].
Figure 4. Automated Toll Collection Workflow.
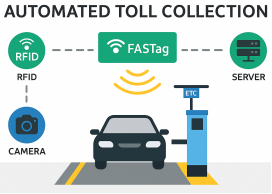
Vehicle Classification: At toll plazas, vehicle classification and identification are carried out to ensure accurate toll assessment and operational fairness. Vehicles are categorized into distinct classes based on the number of axles, overall vehicle dimensions, and intended vehicle purpose, such as passenger or commercial use. This classification is performed through a combination of visual inspection, axle sensors, RFID/FASTag data, and automated vehicle detection systems. Each vehicle category is mapped to a predefined toll rate, ensuring consistency, transparency, and equitable toll collection while supporting efficient traffic processing and regulatory compliance [
Figure 5].
Toll Booth Infrastructure: Modern toll booths are equipped with essential infrastructure to ensure safe, secure, and efficient toll collection operations. These include automated barriers or gates to regulate vehicle entry and exit, RFID/FASTag readers for electronic toll collection, and vehicle detection sensors for accurate classification. Toll booths are supported by cameras, intercom systems, and control terminals to monitor transactions and address exceptions. In addition, display boards and signal indicators guide drivers through payment lanes, while integration with centralized monitoring systems enables real-time tracking, control, and enforcement of toll operations.
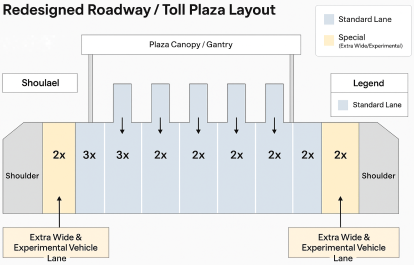
Lane Discipline Management and Allocation: Toll plazas in India implement structured lane discipline and allocation strategies to ensure smooth traffic flow and minimize congestion
. Dedicated lanes are allocated based on vehicle categories, such as passenger vehicles, buses, and trucks, to manage varying vehicle sizes, speeds, and service requirements effectively
. In addition, separate lanes are designated for Electronic Toll Collection (ETC) users, primarily FASTag, and for cash payment transactions, enabling faster processing for electronic payments and reducing delays caused by manual toll collection. Clear lane markings, overhead signage, color coded indicators, and digital display boards are used to guide drivers to the appropriate lanes, while toll operators and traffic marshals actively manage lane discipline during peak hours to maintain order and operational efficiency.
Traffic and Congestion Management at Toll Plazas: Smooth traffic flow at toll plazas in India is ensured through a combination of human supervision and intelligent traffic management measures. Trained traffic management personnel are deployed to regulate vehicle movement, assist drivers in lane selection, and manage congestion during peak hours. Clear and standardized signage is installed well in advance of toll plazas to guide drivers toward appropriate lanes based on vehicle type and payment method. Additionally, electronic display boards provide real-time information on toll rates, FASTag usage, lane status, and payment instructions, helping drivers make timely decisions and reducing lane changing conflicts. These coordinated measures play a crucial role in minimizing delays, preventing bottlenecks, and maintaining safe and efficient toll plaza operations.
Data Security Standards & Compliance: Toll plazas in India implement comprehensive security measures to monitor, control, and safeguard all operational events, ensuring smooth and lawful toll collection. CCTV cameras are installed across toll lanes, entry and exit points, and control rooms to provide real-time monitoring, incident recording, and evidence for dispute resolution. Trained security personnel are stationed at critical locations to manage traffic violations, prevent toll evasion, and respond promptly to emergencies or suspicious activities. Additionally, automated barriers and access control gates regulate vehicle entry and exit, ensuring that vehicles proceed only after valid toll payment or authorization. These integrated security measures help maintain operational integrity, enhance safety, and support effective enforcement at toll plazas.
Record-Keeping Mechanisms at Toll Plazas: Toll plazas in India employ comprehensive record keeping mechanisms to capture transaction, vehicle, image, and operational data for every vehicle passing through the toll gate. This information is retained notes for audit, compliance, and dispute resolution, with retention periods ranging from 30 days for CCTV footage to up to 10 years for financial and transaction records. Data security is ensured through role-based access controls, encryption, secure network infrastructure, and compliance with national IT and payment security standards, ensuring transparency, integrity, and protection of sensitive information. Other operational data to ensure transparency, enable audits, and support data driven decision making.
This comprehensive methodology ensures toll plazas operate efficiently while maintaining compliance, enhancing road user convenience, and reducing operational inefficiencies. The integration of ETC systems like FASTag plays a pivotal role in modernizing toll collection and minimizing congestion at toll plazas.
Figure 5. Modern Automated Toll Collection Workflow.
2. Literature Review
2.1. Toll Plaza Queueing Studies
Toll plaza congestion has been widely recognized as a critical operational issue in highway transportation systems, particularly under mixed traffic and peak hour conditions [
Figures 2, 3]. Early studies on toll plaza performance primarily focused on manual toll collection systems, identifying toll transaction time and booth capacity as dominant contributors to vehicle delay. With increasing traffic volumes, researchers emphasized the need for analytical tools capable of estimating queue length, waiting time
, and service efficiency at toll facilities.
Several case-based studies have applied [
Table 1] queueing theory
to toll plazas to evaluate operational performance and propose in restructure or operational improvements. These studies generally report that congestion at toll plazas is not solely attributable to insufficient roadway capacity but is often driven by imbalances between arrival rates and service rates, inefficient lane allocation, and downstream merging constraints. More recent research highlights that toll plazas act as localized bottlenecks, where even minor increases in demand can cause disproportionate increases in delay.
With the introduction of electronic toll collection (ETC) systems, recent toll plaza studies have shifted attention toward comparative assessments of cash versus electronic lanes
. Findings consistently show that ETC lanes significantly reduce service time and queue length; however, several studies note that overall congestion may persist due to lane merging behavior and uneven lane utilization after toll payment.
2.2. Application of M/M/1 and M/G/1 Models in Transportation
Queueing models such as M/M/1, M/M/c, and M/G/1 have been extensively used in transportation engineering to analyze systems characterized by stochastic arrivals and service processes
. The M/M/1 model, which assumes Poisson arrivals and exponential service times, has been widely adopted due to its mathematical simplicity and analytical tractability. It has been applied to toll booths, parking exits, signalized intersections, and border crossings to estimate average waiting time and system utilization. However, several transportation studies report that toll transaction times often exhibit high variability, influenced by factors such as payment method, vehicle class, driver behavior, and enforcement procedures. Under such conditions, the exponential service time assumption of the M/M/1 model becomes restrictive. Consequently, researchers have increasingly adopted the M/G/1 model, which allows for a general service time distribution while retaining the Poisson arrival assumption
.
Comparative studies between M/M/1 and M/G/1 models demonstrate that ignoring service time variability can lead to underestimation of waiting time and queue length, particularly during peak demand. In the context of toll plazas, the M/G/1 framework has been shown to better capture real world operating conditions, especially in mixed traffic environments where service heterogeneity is significant
. Despite these advances, many transportation studies rely on theoretical assumptions or simulated data, with limited use of det ailed field observations to validate arrival and service distributions
.
2.3. Identified Gaps in Existing Research
A critical review of existing literature reveals several gaps:
1) Limited field validated studies : Many queueing based toll plaza
studies rely on assumed arrival and service distributions without statistically validating them using observed data.
2) Overreliance on M/M/1 models: Despite known service time variability at toll booths, several studies continue to apply M/M/1 models without justification, potentially underestimating congestion levels.
3) Insufficient focus on mixed traffic and lane interaction: Existing studies often analyze toll booths in isolation and do not adequately account for lane allocation (cash vs ETC) and post toll merging effects, which significantly influence congestion.
4) Lack of Indian highway specific empirical evidence: While ETC adoption (FASTag) has expanded rapidly in India, there is a scarcity of location specific, data driven studies evaluating toll plaza performance under Indian traffic conditions [
Figures 2, 3]. Theory Applied in Queuing Model Poisson distribution
.
2.4. Research Gap and Contribution of the Present Study
The present study addresses these gaps by providing a field validated, analytical evaluation of toll plaza performance on a major Indian national highway. Unlike prior studies, this research:
1) Statistically validates Poisson arrival behavior using observed time headway data
2) Demonstrates that toll booth service times follow a general distribution, justifying the use of the M/G/1 model
3) Compares M/M/1 and M/G/1 frameworks to highlight the impact of service variability on congestion estimation
4) Integrate operational factors such as FASTag adoption and lane management into the queueing analysis
5) Provides empirical evidence from an Indian highway toll plaza, contributing region specific insights to the literature
By combining field data with analytically robust queueing models
, this study contributes a practical decision support framework for toll plaza planning and operations, particularly relevant for emerging economies with mixed traffic conditions.
2.5. Model Adoption
The M/M/1 queuing model
is one of the most fundamental models used to describe systems with a single server, Poisson arrivals, and exponentially distributed service times. It is widely applied across fields such as telecommunications, computer systems, and operations research. The notation M/M/1 refers to the following parameters:
1) "M": Represents Poisson arrivals, meaning that customer arrivals follow a Poisson process, occurring randomly and independently over time.
2) "M": Represents exponential service times, indicating that the time required to serve a customer follows exponential distribution.
3) "1": Denotes a single server in the system.
A key characteristic of the M/M/1 model is that customers arrive randomly and independently, with service occurring on a first-come, first served basis.
1) The arrival rate is denoted by λ (lambda), while the service rate of the server is represented by μ (mu)
2) The utilization factor (ρ), which is the ratio of the arrival rate to the service rate, plays a crucial role in analyzing the system's performance
3) The central equation for the M/M/1 model is Little’s Law, which relates the average number of customers in the system (L), the average time a customer spends in the system (W), and the arrival rate (λ): 𝐿 = 𝜆 ×𝑊
Additionally, the utilization factor (ρ) is calculated as: 𝜌 = 𝜆𝜇.
The average number of customers in the system (L) and the average time a customer spends on system (W) can be derived from the following formulas:
These equations are essential for analyzing and optimizing the performance of a single server queuing system with Poisson arrivals and exponentially distributed service times. They offer insights into key performance metrics, such as queue length and waiting time, and help to understand the relationship between system utilization and overall performance.
2.6. Theory Applied in Queuing Model Poisson Distribution
Poisson distribution is a fundamental tool in queuing theory
and many other fields where random arrivals or events occur independently over time
. It offers a probabilistic framework for describing and analyzing such processes, making it an indispensable component of queuing models and related applications.
In queuing models, Poisson distribution is commonly used to model the arrival process of customers or entities into a system
| [7] | Adan, I., Boxma, O., Resing, J., Queueing Models with Multiple Waiting Lines.,
https://doi.org/10.1023/A:1011040100856 |
| [13] | Wooding, S., Bowater, J., Poisson Distribution Calculator, Ref Url:
https://www.omnicalculator.com/statistics/poisson-distribution |
[7, 13]
. Specifically, it describes the random and independent arrival of customers over time. Here is how the Poisson distribution is applied in queuing models:
1) Arrival Rate (λ): In many queuing systems, customer arrivals are assumed to follow a Poisson process. The parameter λ (lambda) represents the average arrival rate per unit of time. For example, in a queuing system at a service center, λ might represent the average number of customers arriving per hour.
2) Interarrival Times: The Poisson distribution allows for the calculation of the probability of a specific number of arrivals within a given time. The interarrival times—the time between successive arrivals—are assumed to follow an exponential distribution, which is the continuous counterpart of the Poisson distribution.
2.7. Probability Mass Function (PMF)
The PMF of the Poisson distribution calculates the probability of observing exact arrivals in a fixed time interval, given the average arrival rate λ. The formula for the PMF is: (𝑋=𝑘)=𝜆𝑘𝑒−𝜆𝑘!
Where: P (X = k) is the probability of k arrivals occurring,
λ is the average arrival rate,
k! is the factorial of k, and
e is Euler's number (approximately 2.71828).
Overall, the Poisson distribution is critical in providing a probabilistic approach to analyzing queuing systems and other stochastic processes, offering valuable insights into the behavior of systems with random arrivals and independent events over time. This formulation is essential for predicting arrival variability and congestion probability
.
Where:
P (X = k) is the probability of k arrivals.
e is the base of the natural logarithm (approximately 2.71828).
λ is the average arrival rate.
k is the number of arrivals.
1) Queueing Analysis: The Poisson distribution models customer arrivals in queuing systems, helping calculate queue length, waiting time, and system utilization for optimization.
2) Traffic Engineering: Used in telecommunications to model packet or call arrivals, aiding in network resource allocation and performance analysis.
Inventory Management: Helps predict random demand, optimize safety stock levels, reorder points, and replenishment strategies.
2.8. The Toll Plaza
The specific type of toll plaza encountered by drivers can vary based on the road network, region, and government policies. With the increasing adoption of electronic toll collection systems like FASTag, India has been transitioning toward more efficient and cashless toll collection methods to reduce traffic congestion and waiting times at toll plazas. India employs multiple toll collection systems including manual tolling, ETC based FASTag systems, hybrid toll plazas, and open/closed toll systems, each designed for specific operational contexts
.
Figure 6. General Layout of the Toll Plaza.
Toll plazas are designed in various configurations to meet different operational and traffic management requirements. Conventional toll plazas require vehicles to stop for cash payment, with collectors issuing receipts, whereas Electronic Toll Collection (ETC) systems enable FASTag equipped vehicles to pass without stopping through automatic toll deduction. FASTag only plazas operate exclusively with electronic payments, eliminating cash transactions, while hybrid toll plazas support both cash and electronic payment lanes. In a closed toll system, toll charges are based on the distance traveled and are collected at the exit point, whereas an open toll system levies a fixed toll before entry onto the tolled roadway [
Figure 6]. Toll collection may be managed through manual systems with physical barriers, where entry is regulated post payment, or manual systems without barriers, where tolls are collected without physical obstructions. Additionally, specialized toll plazas provide dedicated lanes for specific vehicle categories, and integrated toll plazas accommodate multiple toll agencies at a single location to enhance operational efficiency.
Toll Plazas at Entry/Exit Points: Toll plazas are often strategically located at entry and exit points of national highways, expressways, and state highways, ensuring proper management of toll collection at these critical junctures [
Figure 7].
Open Toll System (Alternative): In an open toll system, vehicles are not always required to pay tolls at each plaza. This system is typically placed outside metropolitan areas, offering toll collection for specific routes or areas.
Closed Toll System (Alternative): In a closed toll system, customers pay tolls based on the number of miles traveled and the type of vehicle. Upon entering the system, they are issued a ticket and pay at the exit, where the toll fee is calculated according to the distance traveled and the vehicle type.
Each toll collection system is designed to meet specific operational needs and facilitate efficient traffic management while balancing convenience and cost effectiveness.
Figure 7. Automate Toll Collection.
2.9. Approaching the Toll Plaza
Approaching the Neelmangala Toll Plaza in Karnataka, India, typically depends on your starting point and the direction you are traveling. The Neelmangala Toll Plaza is located on National Highway 4 (NH4), which is a major highway connecting Bengaluru to other cities like Tumakuru and Pune. Here are some general directions on how to approach the Neelmangala Toll Plaza from different starting points from Bengaluru City Center:
1) Start from the city center of Bengaluru, depending on your location.
2) Head north on Tumakuru Road (NH4) towards Neelmangala. Continue NH4, and you will eventually reach the Neelmangala Toll Plaza.
3) From Tumakuru: If you are coming from Tumakuru, start by heading south on NH4 towards Bengaluru. Continue NH4, and you will eventually reach the Neelmangala Toll Plaza.
4) From Pune or Mumbai: If you are traveling from Pune or Mumbai, follow NH4 eastward. Pass through cities like Pune, Solapur, and Bijapur until you reach Karnataka Continue on NH4 until you reach the Neelmangala Toll Plaza.
5) Using Navigation Apps: For real-time directions and traffic updates, it is advisable to use navigation apps such as Google Maps, Waze, or a GPS device. These apps can provide you with the most accurate and up-to-date information on your route to the Neelmangala Toll Plaza, considering current traffic conditions and road closures.
Paying Toll at Neelmangala Toll Plaza: When you approach the toll plaza, follow the designated lanes for your type of vehicle (e.g., passenger car, commercial vehicle) and payment method (cash or electronic toll collection).
Please note that road conditions and toll rates may change over time, so it is a clever idea to check for the latest information and plan your journey accordingly. Additionally, obey traffic rules and drive safely while approaching and passing through toll plazas.
Queue Analysis at Toll and Parking Exit Plazas: This research compares multi server queuing models and traffic simulation for estimating wait times and queue lengths at toll and parking exit plazas. While queuing models provide useful approximations, they fail to account for vehicle lane switching behavior. A traffic simulation model, applied to airport exit plazas, offers a more detailed analysis by incorporating variable arrival channels and real world data. The results highlight simulation as a superior tool for planning and managing toll facilities. Additionally, queuing theory applications
in traffic management, including signalized intersections and toll plazas, are explored, demonstrating its potential for optimizing traffic flow and reducing congestion
.
3. Field Research
3.1. General
To understand the theory behind queuing a toll plaza has been selected in the present research which is located on NH-75 in Karnataka Stretch Neelmangala Junction to Devihalli Tollable near Doddakarenahalli (Neelmangala). Field studies were conducted at the Neelmangala–Devihalli Toll Plaza on NH-75, involving traffic volume counts, space mean speed measurement, inter-arrival time analysis, and service time observation
| [3] | Kavin Malar, K., Gogula Chezhiyan, N., Design of Toll Plaza – A Case Study, MATEC Conf., Ref Url:
https://doi.org/10.1051/matecconf/202440003008 |
| [4] | Gaddam, H. K., Rao, K. R., Speed–Density Relationship, Springer, https://doi.org/10.1007/s40534-018-0177-7 |
| [11] | Mathew, T. V., Traffic Stream Models, IIT Bombay, Ref Url:
https://www.civil.iitb.ac.in/tvm/nptel/513_TrStream/web/web.html |
[3, 4, 11]
.
3.2. Road Inventory
The Devihalli Tollable near Doddakarenahalli (Neelmangala) forms a part of National Highway NH-75, connecting Neelmangala Junction to Devihalli in Karnataka. The tollable stretch has a total length of 40.131 km, with the toll plaza located at km 32.600 near Doddakarenahalli (Neelmangala). The Toll Plaza is operated by M/s Lanco Devihalli Highways Ltd. The effective fee date for toll collection is 01 April 2023, with the next toll revision due on 31 March 2024. The fee notification date is 27 April 2011, and the commercial operations commenced on 23 June 2012, in accordance with the 1997 toll fee rules. The project capital cost for the Devihalli Tollable is 736 crores. As of 02 December 2015, the recorded traffic volume was 29,348 PCU/day, against a design capacity of 57,707 PCU/day, while the target traffic volume for 31 January 2018 was projected at 25,292 PCU/day. The toll rates for different vehicle categories are presented in the subsequent [
Table 2].
Table 2. Toll data matrix with the journey rate.
Vehicle Type | Single Journey | Return Journey | Monthly Pass | Commercial Vehicle Registered within district of plaza |
Car/Jeep/Van | Rs. 50.00 | Rs. 30.00 | Rs. 1570.00 | NA |
LCV | Rs. 90.00 | Rs. 45.00 | Rs. 2750.00 | NA |
Bus/Truck | Rs. 185.00 | Rs. 90.00 | Rs. 5495.00 | NA |
Upto 3 Axle Vehicle | Rs. 295.00 | Rs. 145.00 | Rs. 8835.00 | NA |
4 to 6 Axle | Rs. 295.00 | Rs. 145.00 | Rs. 8835.00 | NA |
HCM/EME | Rs. 295.00 | Rs. 145.00 | Rs. 8835.00 | NA |
7 or more Axle | Rs. 295.00 | Rs. 145.00 | Rs. 8835.00 | NA |
3.3. The Pavement Structure
The pavement structure of the Devihalli Tollable near Doddakarenahalli (Neelmangala) consists of a four lane divided carriageway with a median width of 4.5 m. The pavement is designed as a flexible pavement system comprising Bituminous Concrete (BC) of 40 mm thickness, Dense Bituminous Macadam (DBM) of 60 mm, Wet Mix Macadam (WMM) of 250 mm, Granular Subbase (GSB) of 200 mm, and a subgrade layer of 500 mm thickness. The pavement design is based on a projected traffic volume of 25,292 PCU/day for the year 2018, with a design life of 15 years. The pavement performance is regularly monitored by the concessionaire through periodic inspections, surveys, and performance tests to ensure structural integrity and serviceability over its intended lifespan [
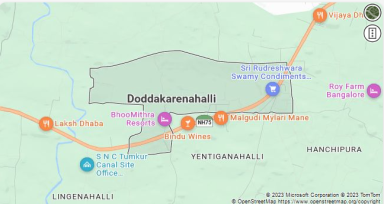
Figure 8].
Figure 8. Geographical Location and Boundary Map of Doddakarenahalli Village along NH-75 Corridor.
3.4. The Queuing Area
Devihalli Tollable near Doddakarenahalli (Neelmangala) is the area where vehicles must wait in line to pay the toll free at the toll plaza [
Figure 8]. The queuing area is designed to accommodate the expected traffic volume and reduce the waiting time for the users. The queuing area has the following features.
The queuing area is located at km 32.600 on NH-75 near Doddakarenahalli (Neelmangala). It is designed with eight lanes in each traffic direction, comprising four dedicated FASTag lanes and four cash payment lanes, to efficiently segregate traffic. The queueing stretch extends for 200 m with a width of 28 m per direction, providing adequate holding space for vehicles. The area is constructed with a paved bituminous concrete surface of 40 mm thickness, ensuring durability under heavy traffic loads. To facilitate smooth operations and effective monitoring, the queuing zone is equipped with signboards, lane markings, traffic signals, and CCTV cameras. The designed capacity of the queuing area is 1,600 PCU/hour per direction, which is sufficient to accommodate the projected peak hour traffic of 1,200 PCU/hour for the year 2018.
3.5. The Traffic Volume
Traffic flow at the Devihalli Tollable near Doddakarenahalli (Neelmangala) is influenced by factors like time of day, season, weather, and road quality. As of December 2, 2015, traffic was recorded at 29,348 PCU/day, below the design capacity of 57,707 PCU/day but exceeding the 2018 projection of 25,292 PCU/day. Peak hours see higher volumes, while off peak times experience lower traffic. The toll plaza's queuing capacity is 1,600 PCU/hour per direction, with congestion occurring if exceeded. Measures like FASTag lanes, traffic signals, and CCTV monitoring help streamline operations, ensuring efficient traffic flow and road maintenance.
3.6. The Traffic Flows in Both Directions of National Highway 75 (NH-75)
Traffic flow on a highway refers to the number of vehicles that pass through a specific point per hour or per day. It is influenced by several factors, including the time of day, day of the week, season, weather conditions, road quality, and overall travel demand. Traffic flow can be measured using various methods, such as manual counting, automatic counting systems, or video analysis. NH-75, according to Wikipedia, is a major national highway in India that passes through the states of Karnataka, Andhra Pradesh, and Tamil Nadu. It connects the port city of Mangalore on the west coast to the city of Vellore in the east. The highway spans a total length of 533 km (331 mi) and traverses all three geographical regions of Karnataka: Karavali, Malenadu, and Bayaluseeme. NH-75 also bypasses key towns such as Hassan and Kunigal. To visualize the traffic flow in both directions of NH-75, I have used Google Maps with the traffic layer enabled to provide an accurate representation of the current traffic conditions. The map below illustrates the real-time traffic data for this highway:
https://www.google.com/maps/dir/Bantwal,+Karnataka/Vellore,+Tamil+Nadu
https://www.google.com/maps/dir/Bantwal,+Karnataka/Vellore,+Tamil+Nadu/@13.3,76.7,7z/data=!5m1!1e1
The map shows NH-75 traffic conditions as of September 27, 2023, at 16:23 GMT+05:30. Green indicates smooth flow, while red signals congestion. Traffic varies due to factors like road width, lanes, toll plazas, and junctions. Bengaluru, Kolar, and Vellore experience heavier traffic, while Bantwal, Sakleshpura, and Hassan see lighter flow. IIT Bombay recommends commercial vehicle traffic for flexible pavement design, projecting flow over a 15 year lifespan to ensure durability.
3.7. The Flexible Pavements
The Devihalli Tollable, located near Doddakarenahalli (Neelmangala), features a flexible pavement design, which is more resilient and durable than rigid pavements due to its ability to bend and deflect under traffic loads. Flexible pavements are constructed in layers, each serving a specific function to ensure long lasting performance. The key components of flexible pavement include:
1) Subgrade: The natural soil or rock layer that forms the foundation for the pavement. It provides stability and drainage and must be properly compacted and graded before the installation of the overlying layers.
2) Subbase: An optional granular layer placed over the subgrade to enhance strength, drainage, and uniformity. It also acts as a cushion to reduce stress on the subgrade.
3) Base: The primary load bearing layer, designed to distribute the traffic load to the underlying layers. Typically made of crushed stone, gravel, or stabilized soil, the base layer is crucial for withstanding traffic and climate impacts. It must be well compacted and sufficiently thick to ensure durability.
4) Surface: The topmost layer in direct contact with traffic, usually made of asphalt concrete, a mixture of bitumen and aggregates. This layer provides a smooth, skid resistant, and waterproof surface, while also protecting the lower layers from moisture and weather.
The Devihalli Tollable is part of NH-75, connecting Neelmangala Junction to Devihalli in Karnataka. The tollable stretch spans a length of 40.131 km, and its pavement structure is designed with the following layers: Bituminous Concrete (BC): 40 mm thick.
1) Dense Bituminous Macadam (DBM): 60 mm thick
2) Wet Mix Macadam (WMM): 250 mm thick
3) Granular Subbase (GSB): 200 mm thick
4) Subgrade: 500 mm thick
The pavement design was based on a traffic projection of 25,292 PCU/day for the year 2018. PCU (Passenger Car Unit) is used to quantify the effect of different vehicle types on traffic flow. One PCU is equivalent to one car, with buses typically counted as three PCUs and motorcycles as 0.5 PCUs. The pavement has a design life of 15 years, and its performance is regularly monitored by the concessionaire through periodic surveys and tests to ensure its durability and safety.
3.8. Space Mean Speed
The Devihalli Tollable, located near Doddakarenahalli (Neelmangala), is part of NH-75, which connects Neelmangala Junction to Devihalli in Karnataka. The tollable stretch spans 40.131 km. As of 02-Dec-2024, the traffic volume at the Devihalli Tollable was 29,348 PCU/day, while the design capacity was 57,707 PCU/day. PCU (Passenger Car Unit) is a standardized unit used to quantify the impact of various vehicle types on traffic flow. One PCU is equivalent to one car, with a bus accounting for three PCUs and a motorcycle for 0.5 PCUs. To estimate the space mean speed on the Devihalli Tollable, we can use the following simplified formula:
Space Mean Speed = (Total distance traveled by all vehicles) / (Total time taken by all vehicles)
Assuming uniform traffic distribution throughout the day and no congestion at the toll plaza, the formula simplifies as follows:
Space Mean Speed = (Tollable length × Traffic volume) / (24 hours × 3600 seconds)
Substituting the values:
Space Mean Speed = (40.131 km × 29,348 PCU/day) / (24 hours × 3600 seconds)
Space Mean Speed ≈ 13.4 km/h
This means that, on average, a vehicle traveling on the Devihalli Tollable would cover 40.131 km in approximately 3 hours.
However, this estimate is based on several assumptions and simplifications. The actual space mean speed can vary due to factors such as road width, number of lanes, toll booths, junctions, bridges, curves, gradients, and other dynamic elements like traffic congestion, vehicle load intensity, weather conditions, and pavement characteristics.
To obtain a more accurate estimate of the space mean speed, advanced techniques like manual counting, automatic counting, or video analysis can be employed to account for real-time traffic conditions and other variables.
3.9. Analysis of Field Data
1) General: The delay and waiting time of drivers in toll plazas depends on service time and arrival rate. The quick service time and number of toll booths can reduce the time wasted in the queue. The wasted time can be calculated and minimized by analysis of the observed data. By calculating the wasted time, the performance of the servers can be analyzed and the delay in overall travel time can be found.
2) Road Inventory: The road inventory reveals that the number of incoming lanes is two and it diverges into five lanes within the queuing area of the toll plaza. The pavement structure before the toll plaza is divided into flexible pavement. The number of lanes is four of width is 9m and the median width is 2.5m. The shoulder is earthen, and the shoulder width is 1.5m. The queuing area is of rigid pavement. The width of the pavement is 30m, and the length of pavement on arrival and merging side is 250m. The number of toll booths on each side is five, the length of the toll booth is 2.4m and the width is 3.6m.
3) Traffic Volume: In the present research the traffic count census is done as per IRC: 9-1972 “Traffic census on Non-Urban Roads”. To consider the randomness, the traffic volume research was carried out in short intervals (4 hours) at different hours of the day and on different days. The average traffic flow rate from Hassan to Bengaluru is 375veh/hr. The average traffic flow rate from Bengaluru to Hassan is 345 veh/hr.
4) Space Mean Speed: Space means speed decreases as traffic flow increases; near the toll booth, it is 21 km/h (Hassan to Bengaluru) and 14 km/h (Bengaluru to Hassan), while away from the queue, it rises to 34 km/h and 26 km/h, respectively.
5) Time Headway: Time headway is the difference between the time the front wheel of a vehicle arrives at a point on the highway and the time the front wheel of the next vehicle arrives at the same point. Time headway can be used to predict the flow rate of vehicles on a section of roadway the field data observed shows that the interarrival time between vehicles was found out to be 10.5s (Bengaluru to Hassan) and 10.2s (Hassan to Bengaluru). Both directions have equal headway, indicating equal flow of vehicles in both directions. Hence this might be one of the reasons for having an equal number of booths in both directions (i.e., five on each side).
6) Arrival Rate: The data obtained from the arrival rate was analyzed using Poisson distribution. The observed frequency (598) is equal to the theoretical frequency (597) as per the Poisson distribution. Hence vehicles arriving at a section of a highway simply follow Poisson distribution. Hence for any future studies to find out arrival rate, Poisson distribution can be made use of.
7) Service Rate: In the present research, the average service time from Hassan to Bengaluru is 18.02 seconds and from Bengaluru to Hassan is 17.06 seconds. The observed data reveals the service rate to be almost equal and hence service rate can be considered as general (G).
8) Traffic Flow: Theory One of the most important equations in traffic flow theory is given between traffic flow (q), traffic density (k), and speed.
In the present research, graphs are plotted to show the behavior of vehicles on the road section. In the present research, the queuing theory was modeled on M/G/1.
M represents the arrival pattern following Poisson distribution; G represents the service pattern considered general and one represents a single booth selected for the analysis.
The M/G/1 queueing model is a widely used mathematical model in queueing theory
. In the context of traffic and transportation, it can be used to analyze a single lane of traffic at a toll plaza, for example.
In the M/G/1 model:
"M" stands for Markovian arrivals, which means that vehicles arrive at the toll plaza following a Poisson process (random arrivals).
"G" stands for a general service time distribution, meaning the time it takes to process a vehicle at the toll booth can follow any general probability distribution.
"1" indicates a single server (toll booth) in this case.
The speed density relationship, in this context, is used to understand how vehicle speed and traffic density (the number of vehicles on the road) are related. The speed density relationship can vary depending on the specific road, traffic conditions, and other factors.
To collect speed density data for an M/G/1 model at a toll plaza, you would typically need to conduct field studies or simulations.
Here is a simplified way to approach this:
1) Data Collection: Collect data on vehicle arrivals and service times. Measure the number of vehicles arriving at the toll plaza per unit time and the time it takes to process each vehicle at the toll booth. This data can be used to estimate the arrival rate (λ) and the service rate (μ).
2) Calculate Traffic Density: Calculate the traffic density by dividing the arrival rate (λ) by the vehicle speed. The traffic density (ρ) is a dimensionless quantity representing the number of vehicles per unit length of the road.
Where:
ρ is the traffic density.
λ is the arrival rate of vehicles.
V is the average speed of vehicles.
Analyze Speed Density Relationship: Analyze the data to understand how changes in traffic density affect vehicle speed. You can plot the speed density relationship, which can take various forms depending on the specific conditions. Please note that real-world traffic is more complex than the simple M/G/1 queueing model, and other factors like lane merging, vehicle types, and driver behavior can influence the speed density relationship. Traffic engineering professionals and researchers often use more advanced models and data collection techniques to understand and manage traffic flow effectively.
4. Results and Discussion
4.1. Comparative Performance of M/M/1 and M/G/1 Models
To evaluate toll booth performance under different modeling assumptions, both M/M/1 and M/G/1 queueing models were applied using observed field data. The M/M/1 model assumes exponential service times, whereas the M/G/1 model incorporates the observed variability in toll transaction times
. [
Table 3] presents a comparative summary of key performance indicators derived from both models for a representative toll booth during peak operating conditions.
Table 3. Comparison of M/M/1 and M/G/1 Queueing Models.
Performance Metric | M/M/1 Model | M/G/1 Model | Observation |
Arrival rate, λ (veh/hr) | Observed | Observed | Same arrival process assumed |
Mean service time (s) | Assumed exponential | Observed general | M/G/1 reflects field variability |
Utilization factor, ρ | Lower | Higher | M/M/1 underestimates congestion |
Average queue length, L | Lower estimate | Higher estimate | Variability increases queue size |
Average waiting time, W (s) | Underestimated | Realistic | M/G/1 closer to field conditions |
Sensitivity to peak demand | Low | High | M/G/1 captures instability |
The results indicate that the M/M/1 model consistently underestimates queue length and waiting time due to its restrictive service time assumption. In contrast, the M/G/1 model provides more realistic estimates, particularly during peak demand periods when service time variability is pronounced. This confirms that toll plaza operations under mixed traffic conditions are better represented by an M/G/1 framework.
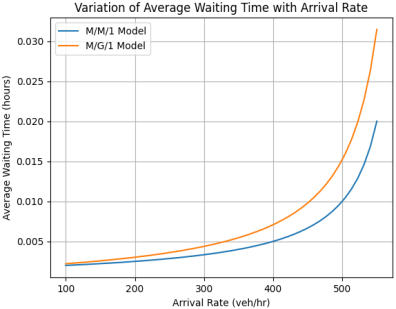
4.2. Waiting Time vs Arrival Rate Analysis
To assess system sensitivity to traffic demand, the average waiting time (W) was analyzed as a function of the arrival rate (λ). Waiting time was computed for incremental increases in arrival rate while keeping the service rate constant. [
Figure 9] illustrates the relationship between waiting time and arrival rate for both queueing models.
Key observations:
1) Waiting time increases non linearly as arrival rate approaches service capacity.
2) For the same arrival rate, the M/G/1 model predicts significantly higher waiting times than the M/M/1 model.
3) Small increases in arrival rate during peak hours lead to disproportionately large delays, indicating system instability near saturation.
This behavior highlights the vulnerability of toll plazas to peak hour congestion and demonstrates that ignoring service variability can lead to misleading operational decisions. The results emphasize the importance of capacity buffers and demand management strategies.
Figure 9. Variation of Average Waiting Time with Arrival Rate for M/M/1 and M/G/1 Models.
4.3. Impact of FASTag on Toll Plaza Performance
To evaluate the operational benefits of electronic toll collection, toll plaza performance was compared under pre-FASTag (predominantly cash-based) and post-FASTag (ETC-enabled) conditions.
Table 4. Toll Plaza Performance: Before and After FASTag Implementation.
Parameter | Before FASTag | After FASTag | Improvement |
Average service time (s) | Higher | Lower | Significant reduction |
Average waiting time (s) | High | Reduced | Faster throughput |
Queue length during peak | Long | Shorter | Improved stability |
Throughput (veh/hr/lane) | Lower | Higher | Increased capacity |
Lane utilization balance | Uneven | Improved | Reduced lane conflicts |
The introduction of FASTag significantly reduced service times and improved throughput. However, the analysis reveals that FASTag alone does not eliminate congestion, particularly during peak periods. Queue formation persists due to lane merging downstream of toll booths and uneven lane utilization, reinforcing the need for integrated operational planning [
Table 4].
Abbreviations
MTF | Modern Toll Facilities |
NH | National Highway |
ETC | Electronic Toll Collection |
RFID | Radio Frequency Identification |
ITS | Intelligent Transportation System |
ORT | Open Road Tolling |
FASTag | RFID-based Electronic Toll Collection System |
PCU | Passenger Car Unit |
BOT | Build–Operate–Transfer |
AADT | Annual Average Daily Traffic |
Acknowledgments
We would like to express our sincere gratitude to the National Highways Authority of India (NHAI) for their invaluable support and collaboration throughout the research process. Their assistance was essential in providing the necessary data and insights for this study. We also extend our heartfelt thanks to the Department of Computer Applications at Dayananda Sagar University for their continued support. The department's resources, facilities, and academic environment have been pivotal in the successful completion of this research. Without the support of both NHAI and Dayananda Sagar University, this research would not have been possible.
Author Contributions
Satendra Chandra Pandey: Conceptualization, Data curation, Formal Analysis, Funding acquisition, Investigation, Methodology, Resources, Software, Supervision, Validation, Writing – original draft, Writing – review & editing
Vasanthi Kumari: Conceptualization, Project administration, Validation
Conflicts of Interest
The authors declare no conflicts of interest.
References
| [1] |
Sangavi, G. V., Megha, G. C., Application of Queuing Theory to a Toll Plaza – A Case Study, IJERT., Ref Url:
https://www.ijert.org/research/application-of-queuing-theory-of-a-toll-plaza-a-case-study-IJERTV6IS060202.pdf
|
| [2] |
PwC, Evolving Toll Payments Landscape in India, Ref Url:
https://www.pwc.in/assets/pdfs/consulting/financial-services/fintech/payments-transformation/evolving-toll-payments-landscape-in-india.pdf
|
| [3] |
Kavin Malar, K., Gogula Chezhiyan, N., Design of Toll Plaza – A Case Study, MATEC Conf., Ref Url:
https://doi.org/10.1051/matecconf/202440003008
|
| [4] |
Gaddam, H. K., Rao, K. R., Speed–Density Relationship, Springer,
https://doi.org/10.1007/s40534-018-0177-7
|
| [5] |
All India Toll Booth Information, Government Data Portal., Ref Url:
https://datais.info/TollInformation/India/Fastag/Karnataka/TollOperation
|
| [6] |
Korstanje, J., Waiting Line Models., Ref Url:
https://web.uettaxila.edu.pk/CMS/AUT2013/ieORbs/notes/Chapter%20-%20Waiting%20Line%20Models.pdf
|
| [7] |
Adan, I., Boxma, O., Resing, J., Queueing Models with Multiple Waiting Lines.,
https://doi.org/10.1023/A:1011040100856
|
| [8] |
MathWorks, M/M/1 Queueing System, Ref Url:
https://in.mathworks.com/help/simevents/ug/m-m-1-queuing-system.html
|
| [9] |
Vandaele, N., A Queueing-Based Traffic Flow Model,
https://doi.org/10.1016/S1361-9209(99)00028-0
|
| [10] |
Simranjeet Nanda; Sivasangari A, Integrated Analysis of Real-Time Traffic Data with M/G/1 Queuing Model in IoT-Enabled Traffic Management
https://doi.org/10.1109/ICTBIG68706.2025.11323685
|
| [11] |
Mathew, T. V., Traffic Stream Models, IIT Bombay, Ref Url:
https://www.civil.iitb.ac.in/tvm/nptel/513_TrStream/web/web.html
|
| [12] |
Percy H. Brill, Server Workload in an M/M/1 Queue with Bulk Arrivals and Special Delays
https://www.scirp.org/journal/paperinformation?paperid=26099
|
| [13] |
Wooding, S., Bowater, J., Poisson Distribution Calculator, Ref Url:
https://www.omnicalculator.com/statistics/poisson-distribution
|
| [14] |
M/G/1 Queue, ScienceDirect., Ref Url:
https://www.sciencedirect.com/topics/computer-science/m-g-1-queue
|
Cite This Article
-
APA Style
Pandey, S. C., Kumari, V. (2026). Optimizing Toll Booth Performance with M/M/1 Queueing Models: Case Research from Indian Highways. International Journal of Transportation Engineering and Technology, 12(1), 1-14. https://doi.org/10.11648/j.ijtet.20261201.11
 Copy
|
Copy
|
 Download
ACS Style
Pandey, S. C.; Kumari, V. Optimizing Toll Booth Performance with M/M/1 Queueing Models: Case Research from Indian Highways. Int. J. Transp. Eng. Technol. 2026, 12(1), 1-14. doi: 10.11648/j.ijtet.20261201.11
Copy
|
Download
AMA Style
Pandey SC, Kumari V. Optimizing Toll Booth Performance with M/M/1 Queueing Models: Case Research from Indian Highways. Int J Transp Eng Technol. 2026;12(1):1-14. doi: 10.11648/j.ijtet.20261201.11
Copy
|
Download
-
@article{10.11648/j.ijtet.20261201.11,
  author = {Satendra Chandra Pandey and Vasanthi Kumari},
  title = {Optimizing Toll Booth Performance with M/M/1 Queueing Models: Case Research from Indian Highways},
  journal = {International Journal of Transportation Engineering and Technology},
  volume = {12},
  number = {1},
  pages = {1-14},
  doi = {10.11648/j.ijtet.20261201.11},
  url = {https://doi.org/10.11648/j.ijtet.20261201.11},
  eprint = {https://article.sciencepublishinggroup.com/pdf/10.11648.j.ijtet.20261201.11},
  abstract = {Efficient toll plaza operations are critical to minimizing congestion and travel delay on high-volume highway corridors. This study investigates the operational performance of a major toll plaza on National Highway-75 (NH-75), India, using queueing theory–based analytical models. Field data were collected at the Neelmangala–Devihalli Toll Plaza, including traffic volume, time headway, arrival rates, service times, and space mean speeds under mixed traffic conditions. Statistical analysis confirms that vehicle arrivals follow a Poisson process, while service times exhibit a general distribution, justifying the application of both M/M/1 and M/G/1 queueing models. Key performance indicators such as system utilization, average queue length, and vehicle waiting time were derived to evaluate toll booth efficiency during peak and off-peak periods. The results indicate that congestion is primarily driven by high arrival rates during peak hours, limited toll booth capacity, and downstream lane merging constraints rather than insufficient roadway capacity. The analysis further demonstrates that the adoption of electronic toll collection (FASTag), optimized lane allocation, and selective booth expansion can significantly reduce average waiting times and improve throughput. This research highlights the practical applicability of queueing theory as a decision-support framework for diagnosing operational bottlenecks and guiding data-driven improvements in toll plaza planning and management on Indian highways.},
 year = {2026}
}
Copy
|
Download
-
TY  - JOUR
T1  - Optimizing Toll Booth Performance with M/M/1 Queueing Models: Case Research from Indian Highways
AU  - Satendra Chandra Pandey
AU  - Vasanthi Kumari
Y1  - 2026/01/23
PY  - 2026
N1  - https://doi.org/10.11648/j.ijtet.20261201.11
DO  - 10.11648/j.ijtet.20261201.11
T2  - International Journal of Transportation Engineering and Technology
JF  - International Journal of Transportation Engineering and Technology
JO  - International Journal of Transportation Engineering and Technology
SP  - 1
EP  - 14
PB  - Science Publishing Group
SN  - 2575-1751
UR  - https://doi.org/10.11648/j.ijtet.20261201.11
AB  - Efficient toll plaza operations are critical to minimizing congestion and travel delay on high-volume highway corridors. This study investigates the operational performance of a major toll plaza on National Highway-75 (NH-75), India, using queueing theory–based analytical models. Field data were collected at the Neelmangala–Devihalli Toll Plaza, including traffic volume, time headway, arrival rates, service times, and space mean speeds under mixed traffic conditions. Statistical analysis confirms that vehicle arrivals follow a Poisson process, while service times exhibit a general distribution, justifying the application of both M/M/1 and M/G/1 queueing models. Key performance indicators such as system utilization, average queue length, and vehicle waiting time were derived to evaluate toll booth efficiency during peak and off-peak periods. The results indicate that congestion is primarily driven by high arrival rates during peak hours, limited toll booth capacity, and downstream lane merging constraints rather than insufficient roadway capacity. The analysis further demonstrates that the adoption of electronic toll collection (FASTag), optimized lane allocation, and selective booth expansion can significantly reduce average waiting times and improve throughput. This research highlights the practical applicability of queueing theory as a decision-support framework for diagnosing operational bottlenecks and guiding data-driven improvements in toll plaza planning and management on Indian highways.
VL  - 12
IS  - 1
ER  -
Copy
|
Download